Meet the December release of DXcharts, our financial charting library! We don’t have stories, but there’s something even better for chartists. Read on to learn what’s new.
Multichart Sync Studies
You might already know that DXcharts can synchronize parameters across multiple charts. Now you can synchronize studies, too! To do so, go to Chart Layout / Synchronize and select Studies in the Synchronize column.
If you add a study to a chart, it will be automatically applied to all charts. In addition, the study settings will be synchronized across charts. Conversely, if you remove a study from the selected chart, it will be removed from all charts in the series.
Compare Charts
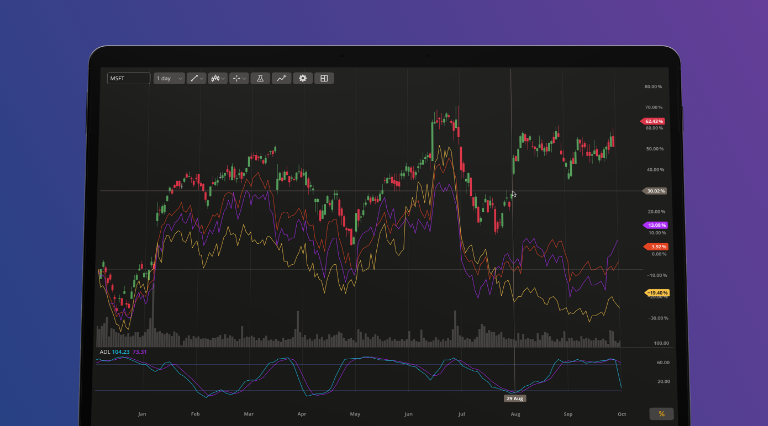
Traders who like their analysis in-depth and thorough often need to reveal and analyze the correlation between two or more instruments. Now, you can use our Compare Charts feature for that! This feature allows you to view price plots for several instruments at a time. Each plot shows the price as a percentage of the first candle’s close. You can also switch to absolute units at any time.
Feel free to add up to 5 price plots to a chart. To do so, click the Add button in the symbol selector mode.
Reworked Data Box
Data Box displays current OHLC, volume, and study values on your chart. We have slightly improved its design. You can now hover and click anywhere on the Data Box to fold or expand it. Also, the values are now shortened automatically to fit in one line (e.g. 1 823 000 to 1.82M).
There is more to come in January! Stay tuned.
The DXcharts team