This fall is the time to chart ahead and draw your exciting future, and we have a handful of new drawings (and your own private programming language!) to help you in this endeavor.
DXscript
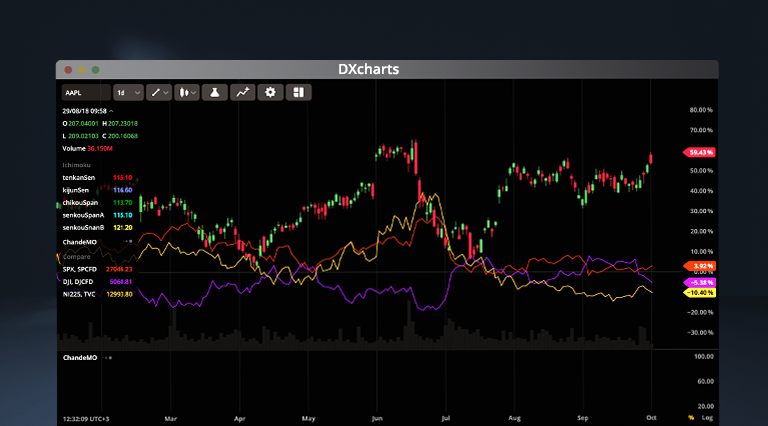
Our team has been working on something that would not just improve the analytical capabilities of the charting package we have to offer, but let the product take another step forward. Meet DXcharts with DXscript.
DXscript is a domain-specific language for series processing. The language is designed to transform one data series into another. The target audience of the DXscript is people without prior programming experience. For this reason, studies written in DXscript tend to be small and comprehensive.
- Unlimited studies. It is no longer ‘40+ indicators’, it can be as many as you want.
- Any parameters you want. Traders & investors are no longer restricted to changing inputs using their mouse or keyboard. Now, they can introduce new inputs, outputs, change the study logic, etc.
Four New Plot Types
We’ve also added four new plot types to give users more versatile charts and additional technical analysis capabilities.
These must-have time-based charts allow technically-minded users to save time and focus on more complex tasks.
Scatterplot. This chart type shows prices as dots scattered on the chart, i.e. without connecting lines. Close prices are shown when zooming. Scatterplot charts are useful for identifying correlation between two or more data points (i.e. prices). They are also handy for identifying outliers or data gaps.
Hollow Candles. Hollow Candles plot the difference not only between the close and the open of the current bar, but also take into account the nearby candles.
Histogram. Histograms are great for showing general distributional aspects of variables. Using a histogram, traders can easily identify distribution peaks and outliers and see the distribution pattern (skewed or symmetric).
Baseline. The Baseline chart shows price movements relative to a trader-selected baseline. This can be very useful for analyzing price fluctuations.
Trade From the Chart
Sure, you were always able to buy or sell instruments right from the chart. This time we bring you a mini order entry on the chart scale. Feel free to issue Market, Limit, Stop Loss, or Take Profit orders without taking your eyes off the chart. Your orders will be automatically grouped if they are close to each other. You will always know how your future order is going to affect you because PL is calculated automatically.
To enable the Trade From the Chart feature, go to Settings and activate the Orders and Positions checkbox. You will be able to see a plus sign on the vertical scale.
Toolbar Improvements
To save space and streamline the UI in the multichart mode, we’ve replaced an individual toolbar for each chart with one toolbar to rule them all. Just click on a chart you wish to control to select it. You are also free to order the buttons inside the toolbar in any way that is convenient.
Even More Drawings
We’ve added a bunch of new drawings, and now you can spend all your mornings and evenings engrossed in technical analysis. Even the tiniest market trend won’t be able to escape you now. Please welcome:
- Arc: moves the third point around across a restricted area
- Fibonacci Arcs: a speed-resistant type of drawing similar to Fibonacci Circles
- Trend-based Fibonacci Retracements: retracements based on a previous trend
- Fibonacci Channel: retracements that can be rotated in any direction to analyze trends from an angle
- Fibonacci Timezones: a sequential drawing bound to time zones
- Gann Fan: a fan-shaped Gann drawing
- Gann Box: a box-shaped Gann drawing
- Gann Square: works like speed-resistant Fibonacci Arcs
- Elliot Impulse Wave: a drawing based on Elliot waves
- Elliot Correction Wave: a drawing based on Elliot waves to analyze correction trends
But wait, here’s more: our chart can now load historical data. As traders browse the current chart, historical data is loaded on the background and accessible in a matter of minutes. Another small but nice improvement: our chart now looks even better on mobile screens. Hurry up to update your trading apps and see for yourself!
Stay tuned,
The DXcharts team