
Acceleration Bands (AB) is a volatility indicator that plots an upper and lower band around a moving average. The band expands when volatility increases and contract when it decreases, forming a dynamic range that adapts to price movement. This structure may help identify potential trend reversals as price interacts with the outer bands. AB uses the Simple Moving Average (SMA) as its base. The midpoint is calculated as the SMA of the closing price, while the upper and lower bands apply a volatility adjustment to the high and low prices before averaging.
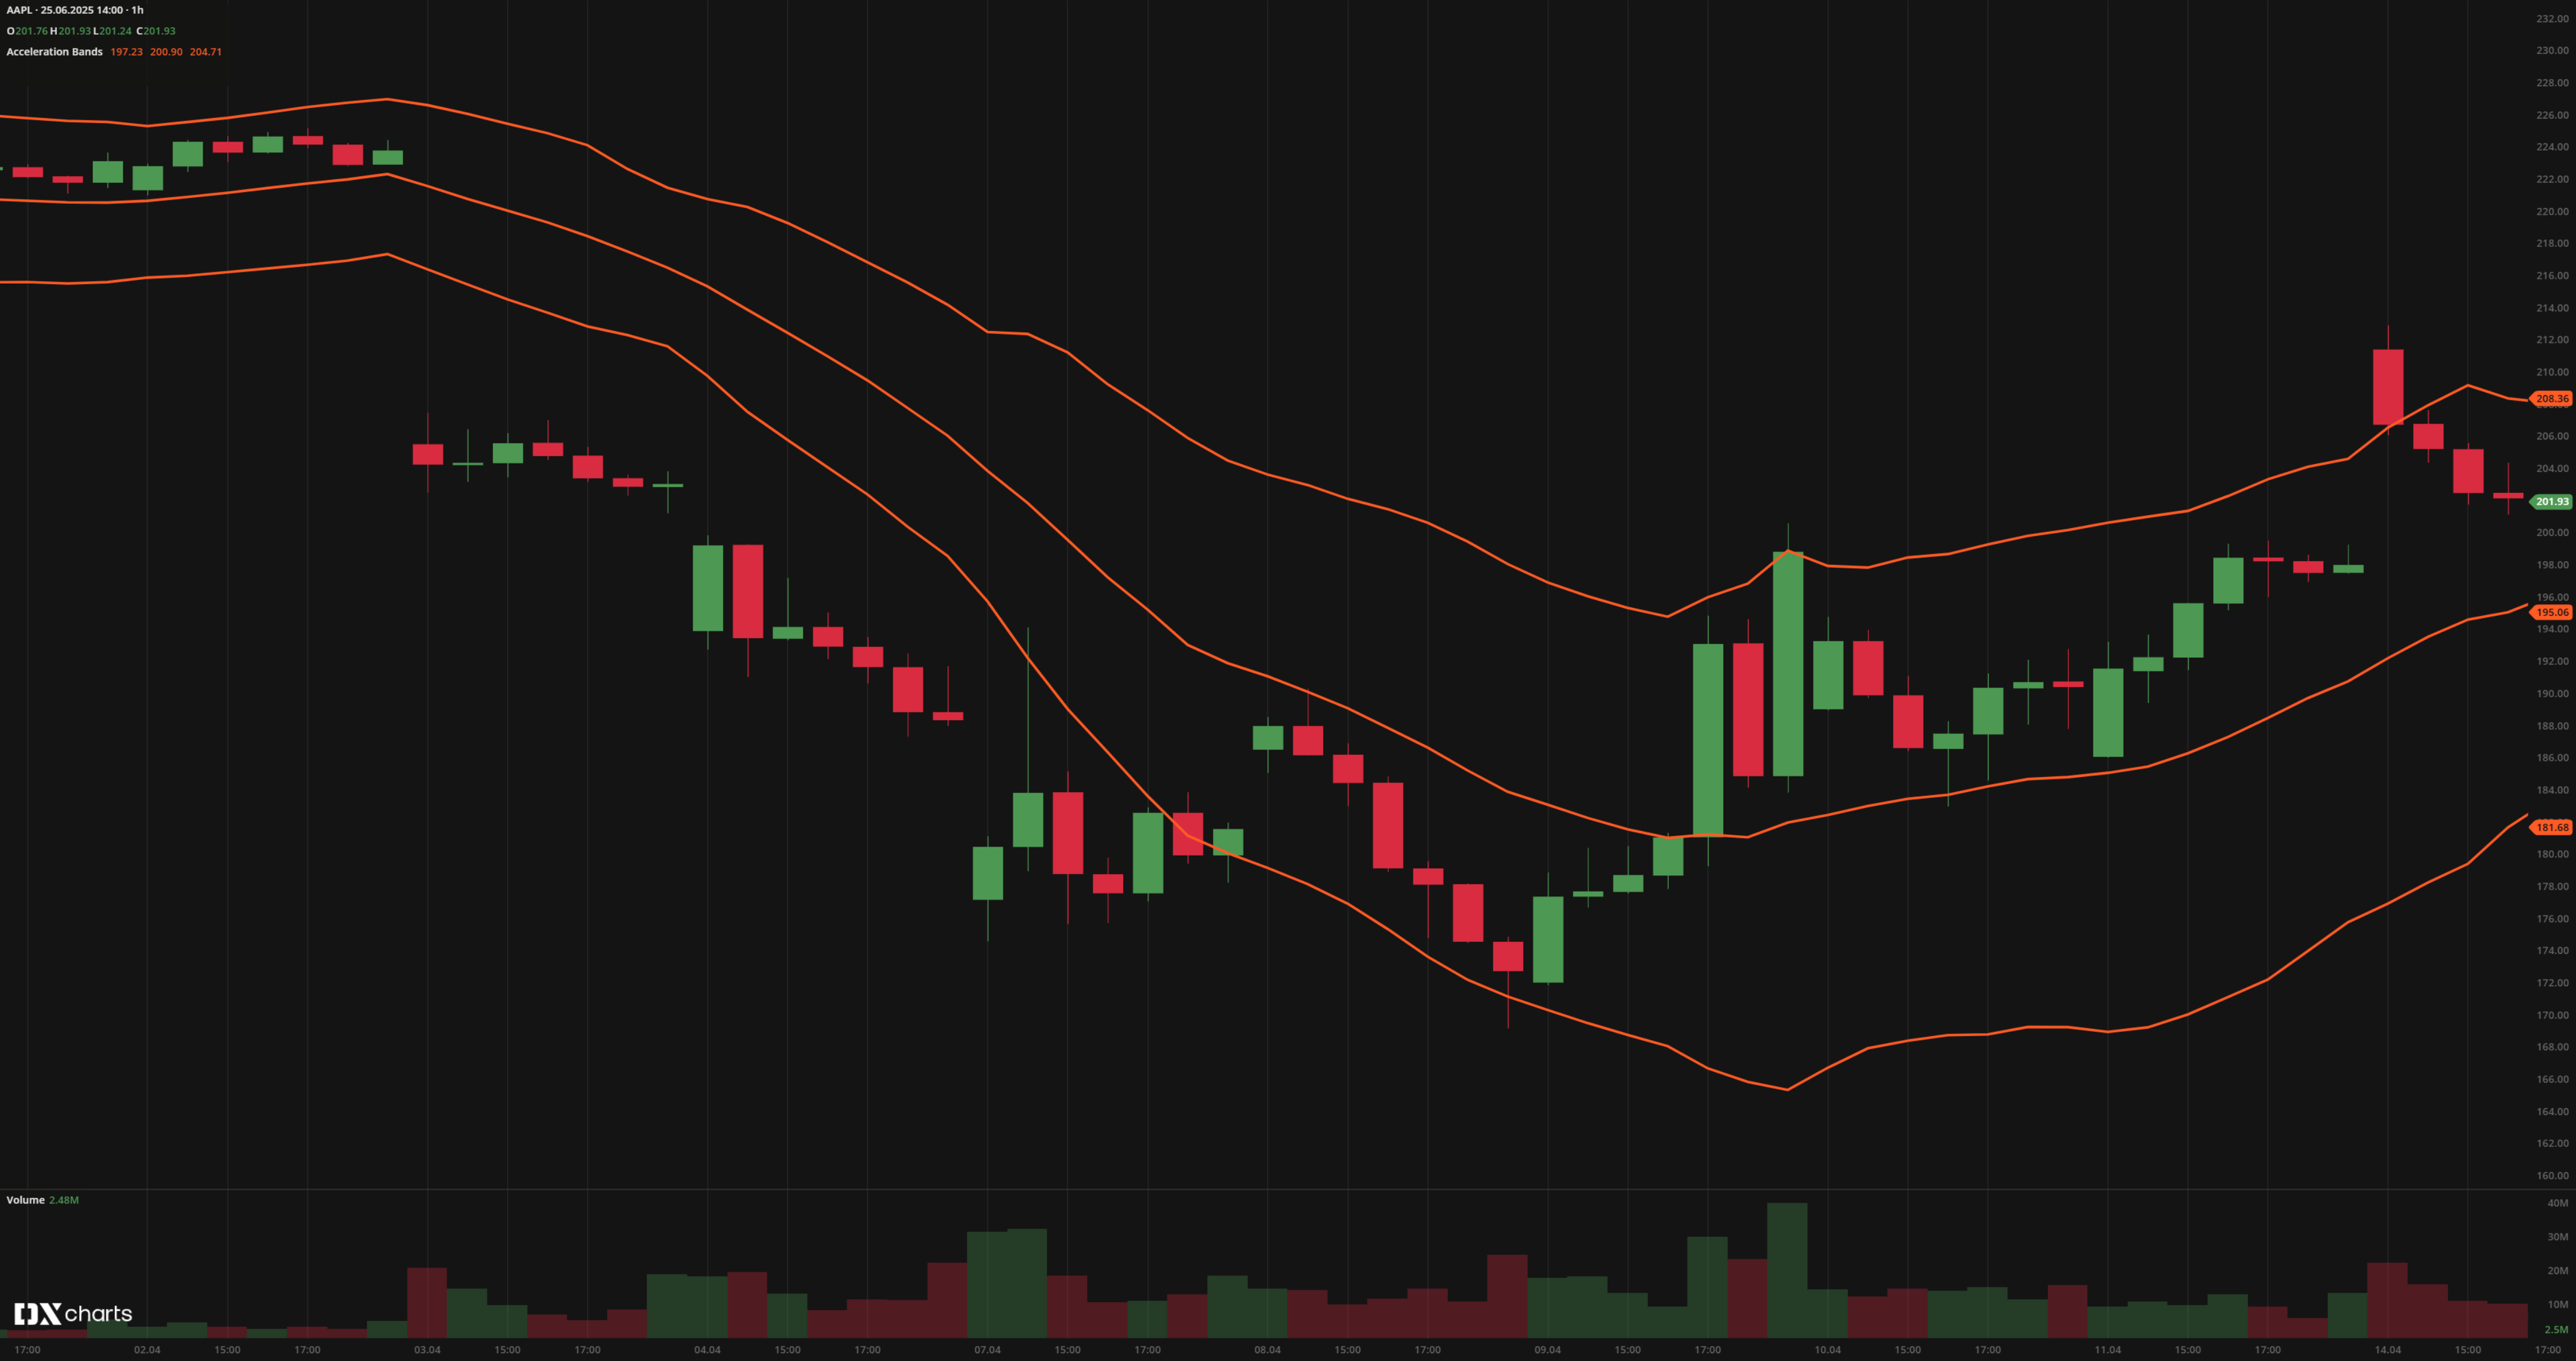
Acceleration Bands (AB)
INPUTS
Input | Description |
|---|---|
Length | The number of periods for the moving average. Accepts integers only. Default is 20. |
PLOTS
The plot renders the data you are working with on the chart. You can show/hide a plot by clicking the corresponding item in the settings. Every plot has a set of basic settings that you can change: color, weight, and type.
Plot | Description |
|---|---|
Upper | The upper Acceleration Band |
Mid Point | The midpoint |
Lower | The lower Acceleration Band |
Color |
|---|
Click the color rectangle under the plot's name to open the palette. Use the slider at the bottom to set the opacity of the color. 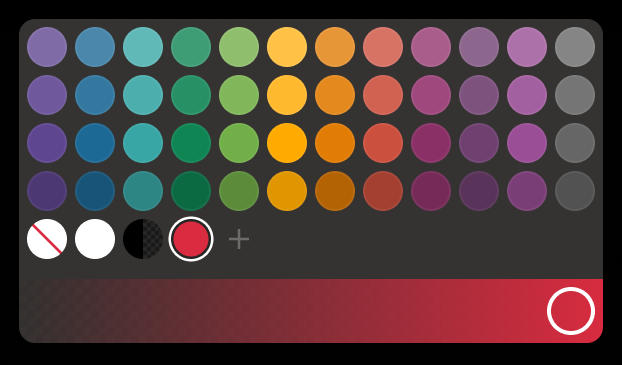 Palette
To create a custom color:
The custom-created colors are added to your palette. To remove a custom color, drag it out of the palette. |
Weight |
Change the value (in px) to adjust the thickness of the plot. |
Type |
The following plot types are available:
|
 to open the color picker
OVERLAYING
Check Overlaying to display the indicator on the chart. Otherwise, the indicator is shown in a study pane down below.
Note: To reset the settings, click Restore to Default next to the SETTINGS: INDICATOR'S TITLE