ATR (Average True Range) Trailing Stops is a volatility-based indicator that helps traders determine where to place Stop Loss orders. It uses the Average True Range (ATR) value to account for market volatility and adjusts the Stop Loss level accordingly. It is calculated by multiplying ATR by a user-defined multiplier and applying this value to the highest High (for long positions) or lowest Low (for short positions). As the price moves favorably, the stop "trails" it, adapting to market volatility to prevent being stopped out too early while protecting capital during reversals.
CALCULATION
ATR Trailing Stops is calculated as follows:
Calculating HiLo (Range), HRef (High Reference) and LRef (Low Reference) variables
HiLo = min(high−low,1.5×Average(high−low, ATRPeriod))
HRef = if low ≤ high[1] then then high - close[1] else (high - close[1]) - 0.5 * (low - high[1]
Lref = if high >= low[1] then close[1] - low else (close[1] - low) - 0.5 * (low[1] - high)
ATRPeriod is Input #2
Calculating TrueRange and Loss variable

modified, unmodified - Input #1
loss = ATRFactor × MovingAverage(averageType, trueRange, ATRPeriod)
ATRFactor - Input #3
averageType - Input #5
ATRPeriod - Input #2
Determining the Trailing Stop.
INPUTS
Input | Description |
|---|---|
Trail Type | Trailing type (Modified or Unmodified). |
ATR Period | Number of periods used to calculate ATR. Positive integer. The default value is 5. |
ATR Factor | ATR multiplier. Positive decimal. The default value is 3.5. |
First Trade | First Trade for calculation (Long, Short). |
Average Type | Implemented average type (Simple, Exponential, Weighted, Wilders). The default value is Wilders. |
PLOTS
The plot renders the data you are working with on the chart. You can show/hide a plot by clicking the corresponding option in the settings. Every plot has a set of basic settings that you can change: color, weight, and type.
Plot | Description |
|---|---|
Width | Plot width |
Buy | Buy value (Red) |
Sell | Sell value (Green) |
Color |
|---|
Click the color rectangle under the plot's name to open the palette. Use the slider at the bottom to set the opacity of the color. 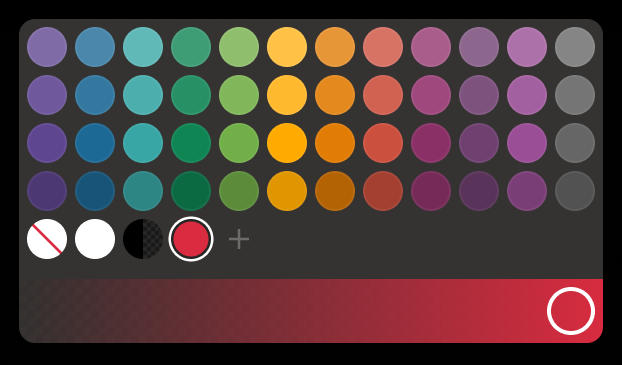 Palette To create a custom color:
The custom-created colors are added to your palette. To remove a custom color, drag it out of the palette. |
Weight |
Change the value (in px) to adjust the thickness of the plot. |
Type |
The following plot types are available:
|
 to open the color picker
OVERLAYING
Check Overlaying to display the study on the chart. Otherwise, the study is shown in a study pane down below.
Note: To reset the settings, click Restore to Default next to the SETTINGS: STUDY'S TITLE