
Bollinger Percent B or % Bollinger Band (%B) pinpoints the position of the current price between the upper and lower Bollinger Bands (BB). It converts this position into a percentage value, offering a clear view of price movement within the band range. This value can help signal when the price is approaching potentially overbought or oversold levels.
The calculation of %B is based on the position of the price within the Bollinger Band range. The difference between the price and the lower band is divided by the total distance between the upper and lower bands. The result is multiplied by 100 to express the value as a percentage.
where:
Price – selected input price
Upper Band – upper Bollinger Band value
Lower Band – lower Bollinger Band value
INPUTS
| Input | Description |
|---|---|
| Length | The number of bars used in the moving average |
| Displace | The number of bars used to offset the band |
| NumDevUp | The standard deviation value (in points) to plot the UpperBand |
| NumDevDown | The standard deviation value (in points) to plot the LowerBand |
| Price |
|---|
The following data sources are available for calculation of MidLine:
|
| Average Type |
|---|
The following Moving Average types are available for calculations:
|
PLOTS
The plot renders the data you are working with on the chart. You can show/hide a plot by clicking the corresponding item in the settings. Every plot has a set of basic settings that you can change: color, weight, and type.
| Plot | Description |
|---|---|
| Bollinger Percent B | The lower deviation from the MidLine |
| Zero Line | The middle line |
| Half Line | The upper deviation from the MidLine |
| Unit Line | The upper deviation from the MidLine |
| Color |
|---|
Click the color rectangle under the plot's name to open the palette. Use the slider at the bottom to set the opacity of the color. 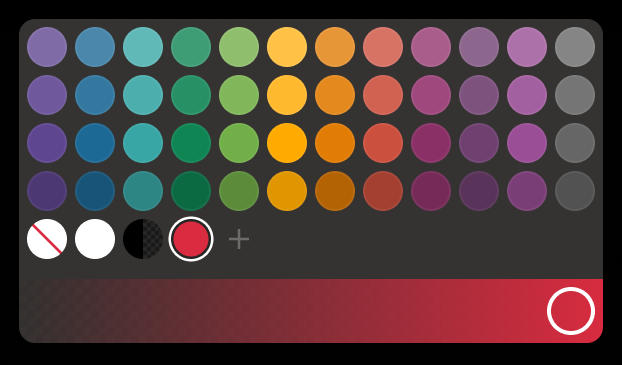 Palette To create a custom color:
The custom-created colors are added to your palette. To remove a custom color, drag it out of the palette. |
| Weight |
| Change the value (in px) to adjust the thickness of the plot. |
| Type |
The following plot types are available:
|
 to open the color picker
OVERLAYING
Check Overlaying to display the indicator on the chart. Otherwise, the indicator is shown in a study pane down below.