
Overview
In addition to the Aggregation periods available from the Toolbar, in DXcharts allows you to create date and time presets. The presets are used to specify a particular aggregation, which is the data aggregated into 1 bar, and the date range – the time period dispalyed in the visible area of the chart. You can create up to 15 presets by manually specifying the amount to be aggregated data for 1 bar and the date range for which the entire chart will be plotted. The preset is then saved as a ready-to-use template that is displayed in the bottom-left corner of the chart for quick access.
How to add a preset
- At the bottom-left corner of the charts, click
 .
- Adjust the aggregation period.
- Adjust the date range.
- Click Save.
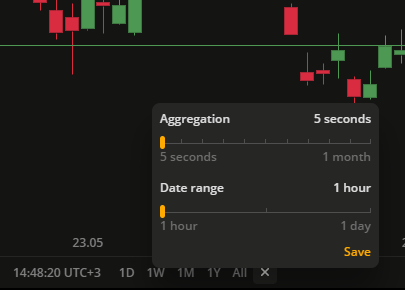 Configure date and time preset
 Click the preset to activate Every aggregation limits the date range you can use it with.
| Aggregation | Date range |
|---|---|
| 5 seconds | 1 hour, 12 hours; 1 day |
| 5 minutes | 1-10, 20, 25, 30, 60, 90 days |
| 15 minutes | 1-10, 20, 25, 30, 60, 90 days |
| 30 minutes | 1-10, 20, 25, 30, 60, 90 days |
| 1 hour | 1-10, 20, 25, 30, 60, 90, 180, 285 days |
| 2 hours | 1-10, 20, 25, 30, 60, 90, 180, 285 days |
| 4 hours | 1-10, 20, 25, 30, 60, 90, 180, 285 days |
| 1 day | 1, 3, 6, 9 months; 1-10, 15, 20, 25 years |
| 1 week | 3, 6, 9 months; 1-10, 15, 20, 25, 30 years |
| 1 month | 1-10, 15, 20, 25, 30 years |
How to remove a preset
- At the bottom-left corner of the chart, click
 .
- Point to any available preset and click
 .
- Click
 .