
DeMarker (DeM) is a technical indicator that derives its values by comparing the most recent maximum and minimum prices with the equivalent prices of the previous period. The indicator attempts to assess the directional bias of the market, so it can be used to determine either when to enter a market, or when to buy or sell an asset.
The DeMax(i): if high(i) > high(i-1), then DeMax(i) = high(i)-high(1), otherwise DeMax(i) = 0
The DeMin(i): if low(i) < low(i-1), then DeMin(i) = low(i-1)-low(i), otherwise DeMin(i) = 0
DeMarker: DMark(i) = SMA(DeMax, N) / [SMA(DeMax, N) + SMA(DeMin, N)]
where:
high (i) – the highest price of the current bar
low (i) – the lowest price of the current bar
high (i -1) – the highest price of the previous bar
low (i - 1) – the lowest price of the previous bar
SMA – Simple Moving Average
N – number of periods used in the calculation
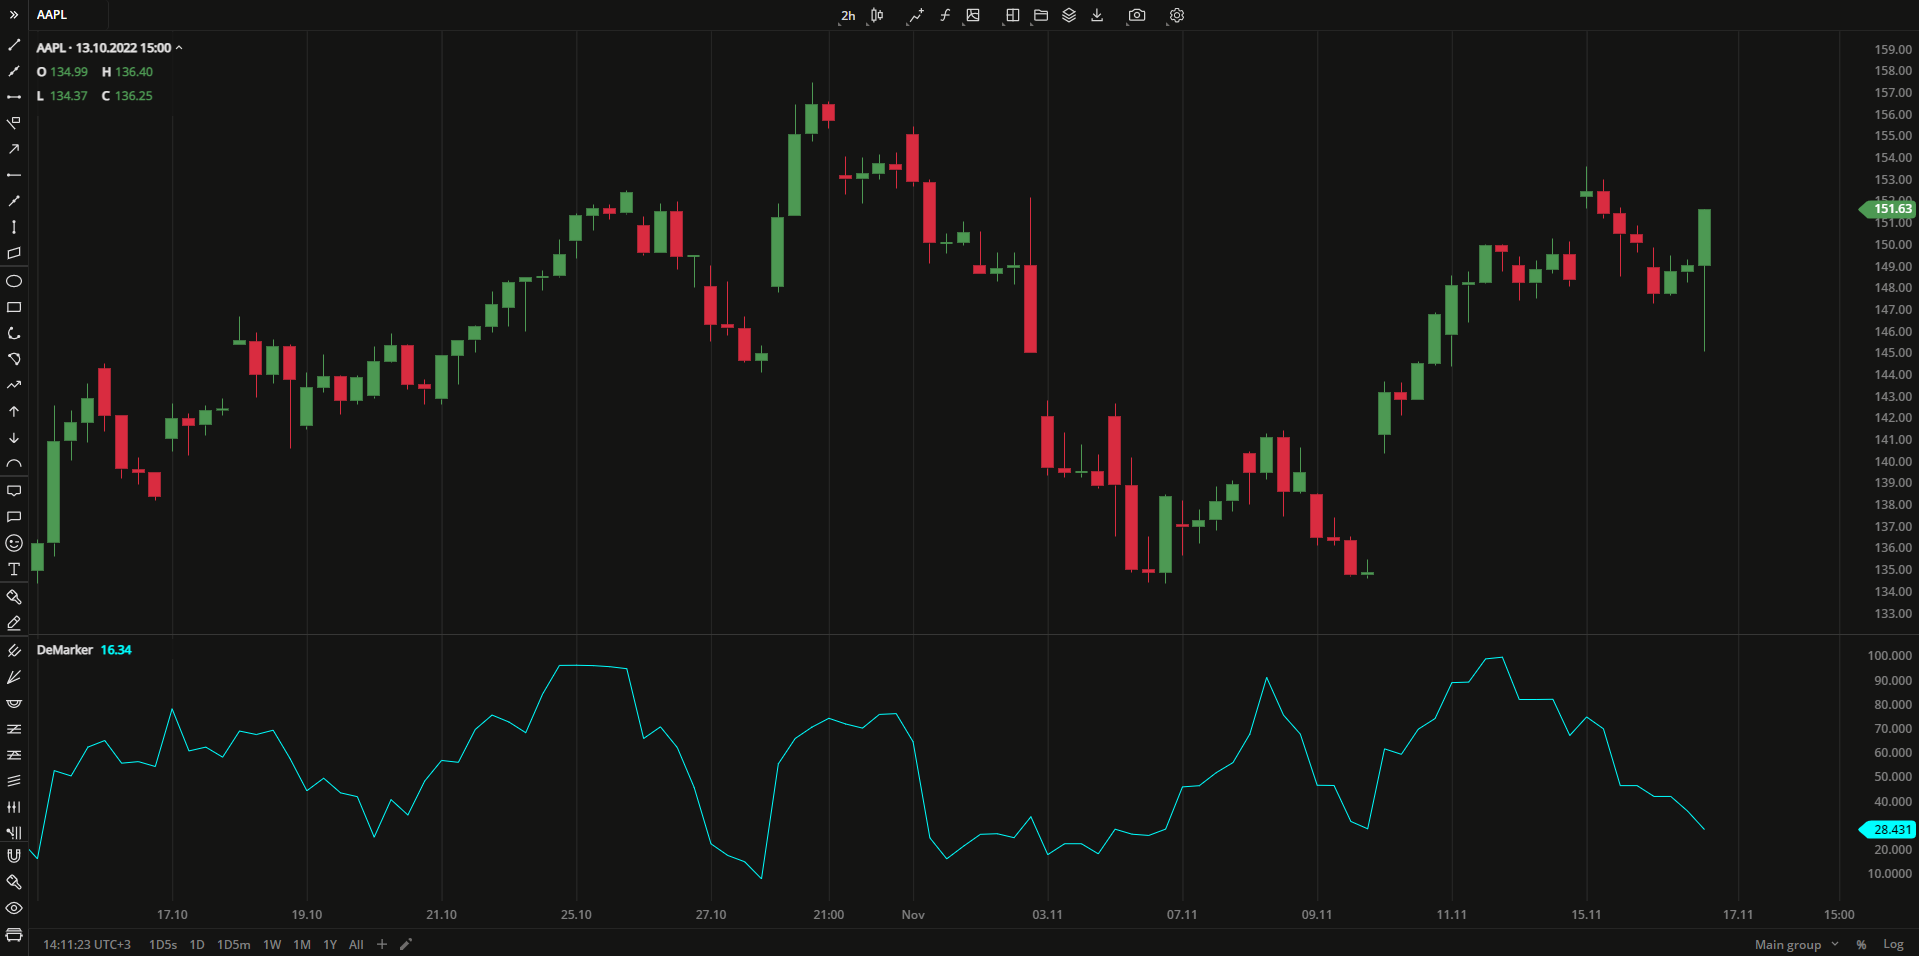 DeMarker
PLOTS
The plot renders the data you are working with on the chart. You can show/hide a plot by clicking the corresponding item in the settings. Every plot has a set of basic settings that you can change: color, weight, and type.
| Plot | Description |
|---|---|
| DeMarker | The DeMarker plot |
| Color |
|---|
Click the color rectangle under the plot's name to open the palette. Use the slider at the bottom to set the opacity of the color. 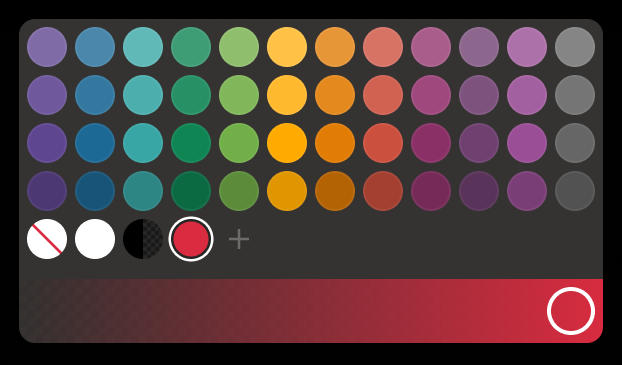 Palette To create a custom color:
The custom-created colors are added to your palette. To remove a custom color, drag it out of the palette. |
| Weight |
| Change the value (in px) to adjust the thickness of the plot. |
| Type |
The following plot types are available:
|
 to open the color picker
OVERLAYING
Check Overlaying to display the indicator on the chart. Otherwise, the indicator is shown in a study pane down below.