
Elliott Impulse (12345) is a tool based on Elliott Wave theory that helps identify long-term price patterns related to persistent changes. It consists of five sub-waves (degrees) that make net movement in the same direction as the trend. This pattern is the most common motive wave and the easiest to spot in a market.
To add Elliott Impulse to the chart, click its name or the icon on the Drawings Panel. Successively, specify points on the chart to draw a wave.
Note: To cancel drawing, press ESC
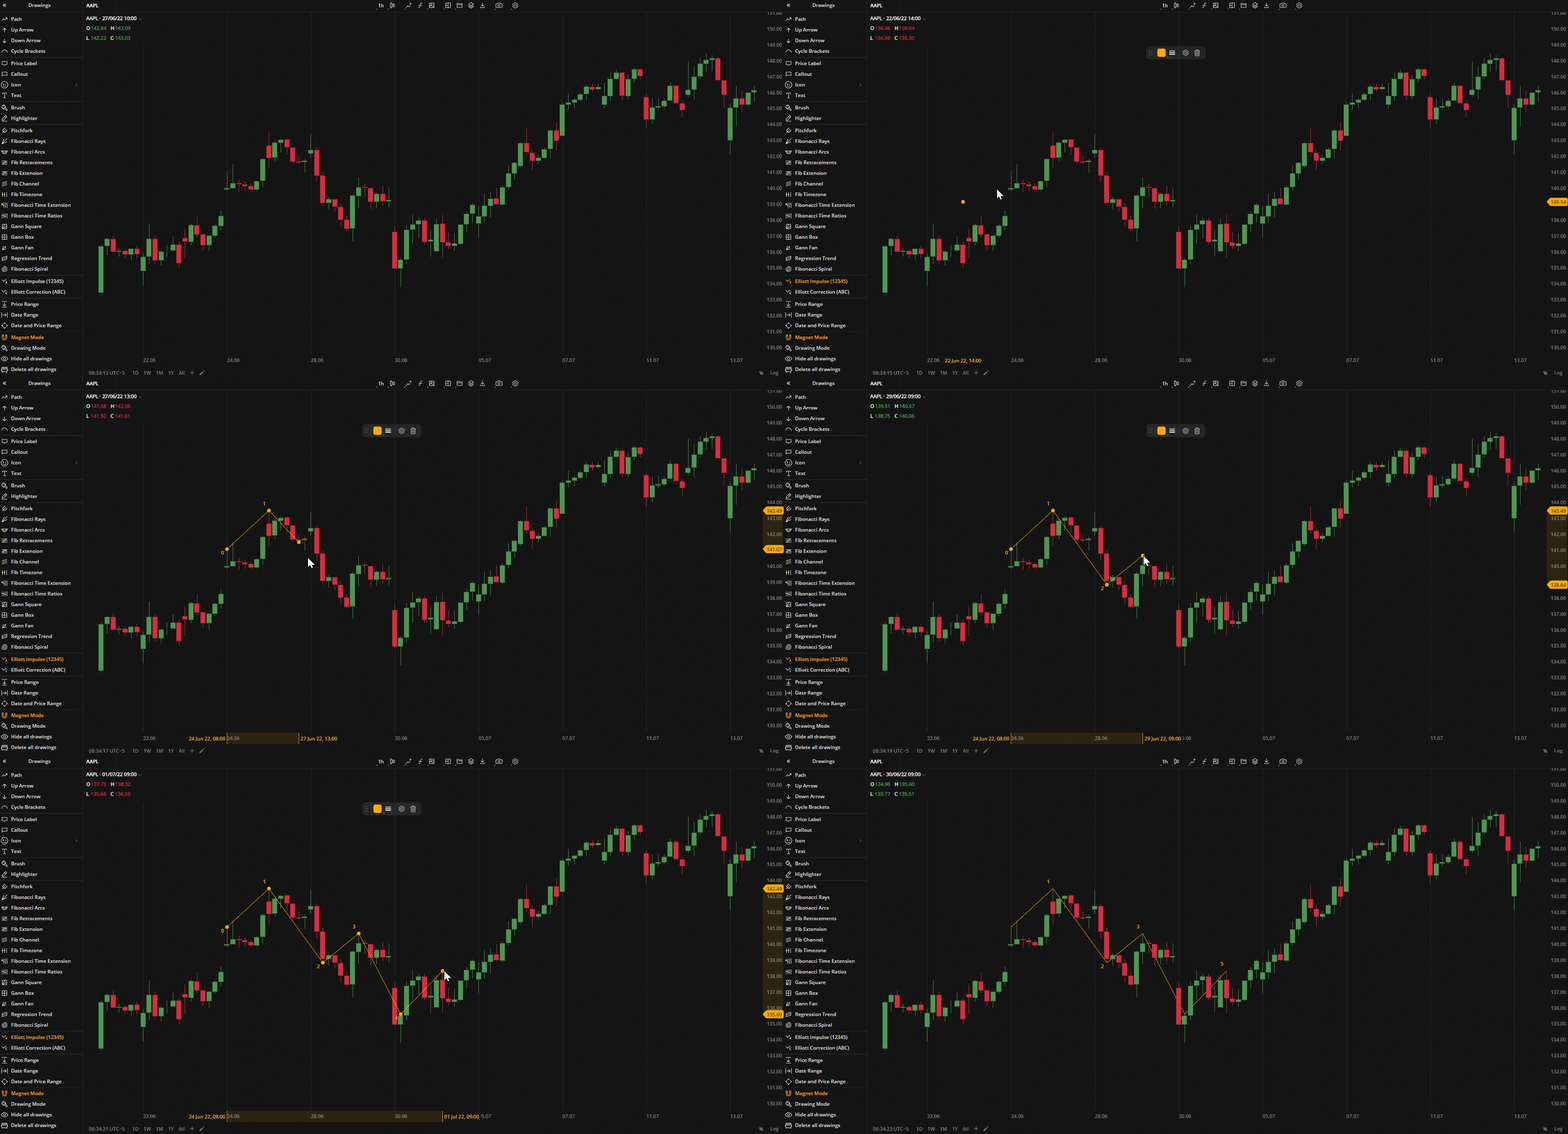 Elliott Impulse
Actions with the Elliott Impulse
- To edit the Elliott Impulse, drag it by one of the points.
- To move the Elliott Impulse, drag it by its line to where you want it on the chart.
Note: To open the settings window, double-click a line on the chart
Elliott Impulse Toolbar

| Color. In the Color section, you can change the color of the Elliott Impulse entirely. The slider at the bottom is intended to set transparency of the color. To create a custom color:
The custom-created colors are added to your palette. To remove a custom color, drag it out of the palette. |
| Weight. In the Weight section, you can set the thickness and style of the Elliott Impulse entirely (currently, only dashed style is available). |
| Settings. A set of parameters that are described in Elliott Impulse Settings. |
| Lock. Locks the drawing position. The figure cannot be moved or edited on the chart. |
| Delete. Removes the Elliott Impulse from the chart. |
 to open the color picker
Note: To delete an Elliott Impulse, you can also press the Delete or Backspace button on your keyboard
Elliott Impulse Settings
- Coordinates. The coordinates of every point of the Elliott Impulse that you can specify manually by filling out the values for the prices, dates and time.
- Style. In this section, you can set a color and style for the Elliott Impulse or turn on/off displaying of its wave.
- Degree. Time span of every degree:
- Subminutte - minutes
- Minuette - hours
- Minute - days
- Minor - weeks
- Intermediate - weeks to month
- Primary - from a few month to two years
- Cycle - one year to several years
- Super Cycle - multi-decade (about 40-70 years)
- Grand Super Cycle - multi-century
Click Close to apply the settings.
Note: At the bottom-left corner of the window, click Restore Defaults to reset the settings