
Fibonacci Timezone is a tool that sets time lines on the chart, the distance between them is based on Fibonacci sequence. The lines are used to forecast potential reversals based on elapsed time.
Fibonacci Timezone is drawn by two extreme points that make up a trendline. To add Fibonacci Timezone to the chart, click its name or the icon on the Drawings Panel. Specify an initial point on the chart (high/low) to start drawing a trendline, then specify the second point to place the time lines.
Note: To cancel drawing, press ESC
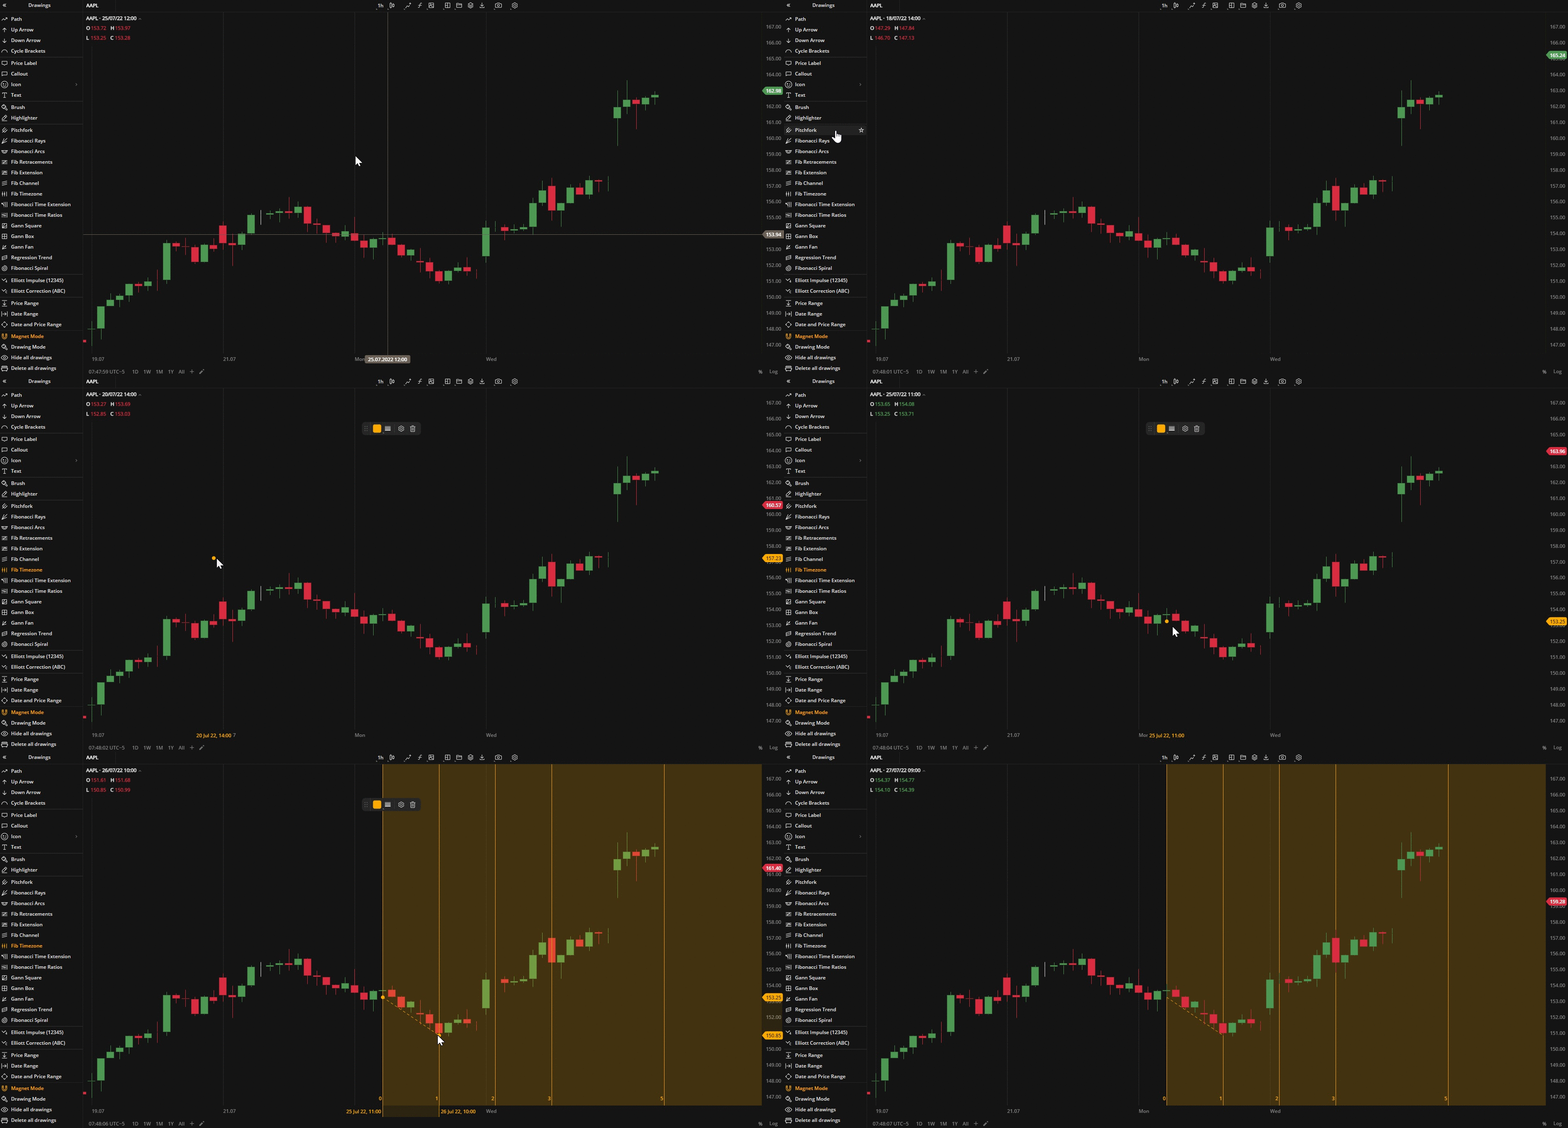 Fibonacci Timezone
Actions with the Fibonacci Timezone
- To edit the Fibonacci Timezone (the trendline), drag it by one of the points.
- To move the Fibonacci Timezone, drag it by one of its lines to where you want it on the chart.
Note: To open the settings window, double-click a line on the chart
Fibonacci Timezone Toolbar
| Color. In the Color section, you can change the color of the Fibonacci Timezone entirely. The slider at the bottom is intended to set transparency of the color. To create a custom color:
The custom-created colors are added to your palette. To remove a custom color, drag it out of the palette. |
| Weight. In the Weight section, you can set the thickness and style of the Fibonacci Timezone entirely (currently, only dashed style is available). |
| Settings. A set of parameters that are described in Fibonacci Timezone Settings. |
| Lock. Locks the drawing position. The figure cannot be moved or edited on the chart. |
| Delete. Removes the Fibonacci Timezone from the chart. |
 to open the color picker
Note: To delete Fibonacci Timezone, you can also press the Delete or Backspace button on your keyboard
Fibonacci Timezone Settings
- Coordinates. The coordinates of the trendline that you can specify manually by filling out the values for the prices, dates and time.
- Labels. In the Labels section, you can choose whether to show coefficients on levels or not. The labels can be aligned left/right of a level and top/middle/bottom of the entire Fibonacci Timezone area.
- Style. In this section, you can set a color or style for the trendline of the Fibonacci Timezone. And separately for every time line, you can set a color, style or offset of the line from its initial position. Turn on/off displaying of a level by clicking to the left of every settings. Also, here you can set background transparency or turn it on/off. Note: To apply the color and style of the trendline to the entire Fibonacci Timezone, click Apply to all
Click Close to apply the settings.
Note: At the bottom-left corner of the window, click Restore Defaults to reset the settings