
Hull Moving Average (HMA) is a trend-based indicator that reacts faster to price shifts than traditional moving averages. It is designed to filter out market noise and produce fewer false signals in sideways markets. HMA uses a layered approach with multiple Weighted Moving Averages (WMA) to reduce lag and improve accuracy in identifying trend direction. It is calculated by subtracting two WMAs of different lengths and running the result through another WMA using the square root of the original period.
where:
n – the number of periods (length)
Price – the price of an asset at each period
[image]
INPUTS
Input | Description |
|---|---|
Length | The number of bars used to calculate the HMA |
Displace | The number of bars the indicator to be shifted to |
Price |
|---|
The following data sources are available for the price:
|
PLOTS
The plot renders the data you are working with on the chart. You can show/hide a plot by clicking the corresponding item in the settings. Every plot has a set of basic settings you can change: color, weight, and type.
Plot | Description |
|---|---|
HMA | The Hull Moving Average plot |
Color |
|---|
Click the color rectangle under the plot's name to open the palette. Use the slider at the bottom to set the opacity of the color. 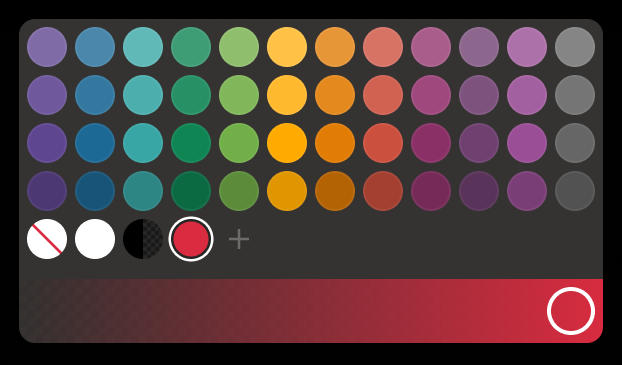 Palette To create a custom color:
The custom-created colors are added to your palette. To remove a custom color, drag it out of the palette. |
Weight |
Change the value (in px) to adjust the thickness of the plot. |
Type |
The following plot types are available:
|
 to open the color picker
OVERLAYING
Check Overlaying to display the indicator on the main chart. Otherwise, the indicator is shown in a study pane down below.
Note: To reset the settings, click Restore to Default next to the SETTINGS: INDICATOR'S TITLE