
The Smoothed Moving Average (SMMA) indicator is an Exponential Moving Average (EMA) smoothed with a longer time period. SMMA takes more data points for calculation and provides more accurate results than Simple Moving Average (SMA) plotting the line with fewer fluctuations.
SMMA = [Sumi-1 - SMMAi-1 + Closei] / n
where:
Sumi-1 – the sum of the source prices over all periods
Closei – the current closing price
n – the number of total periods
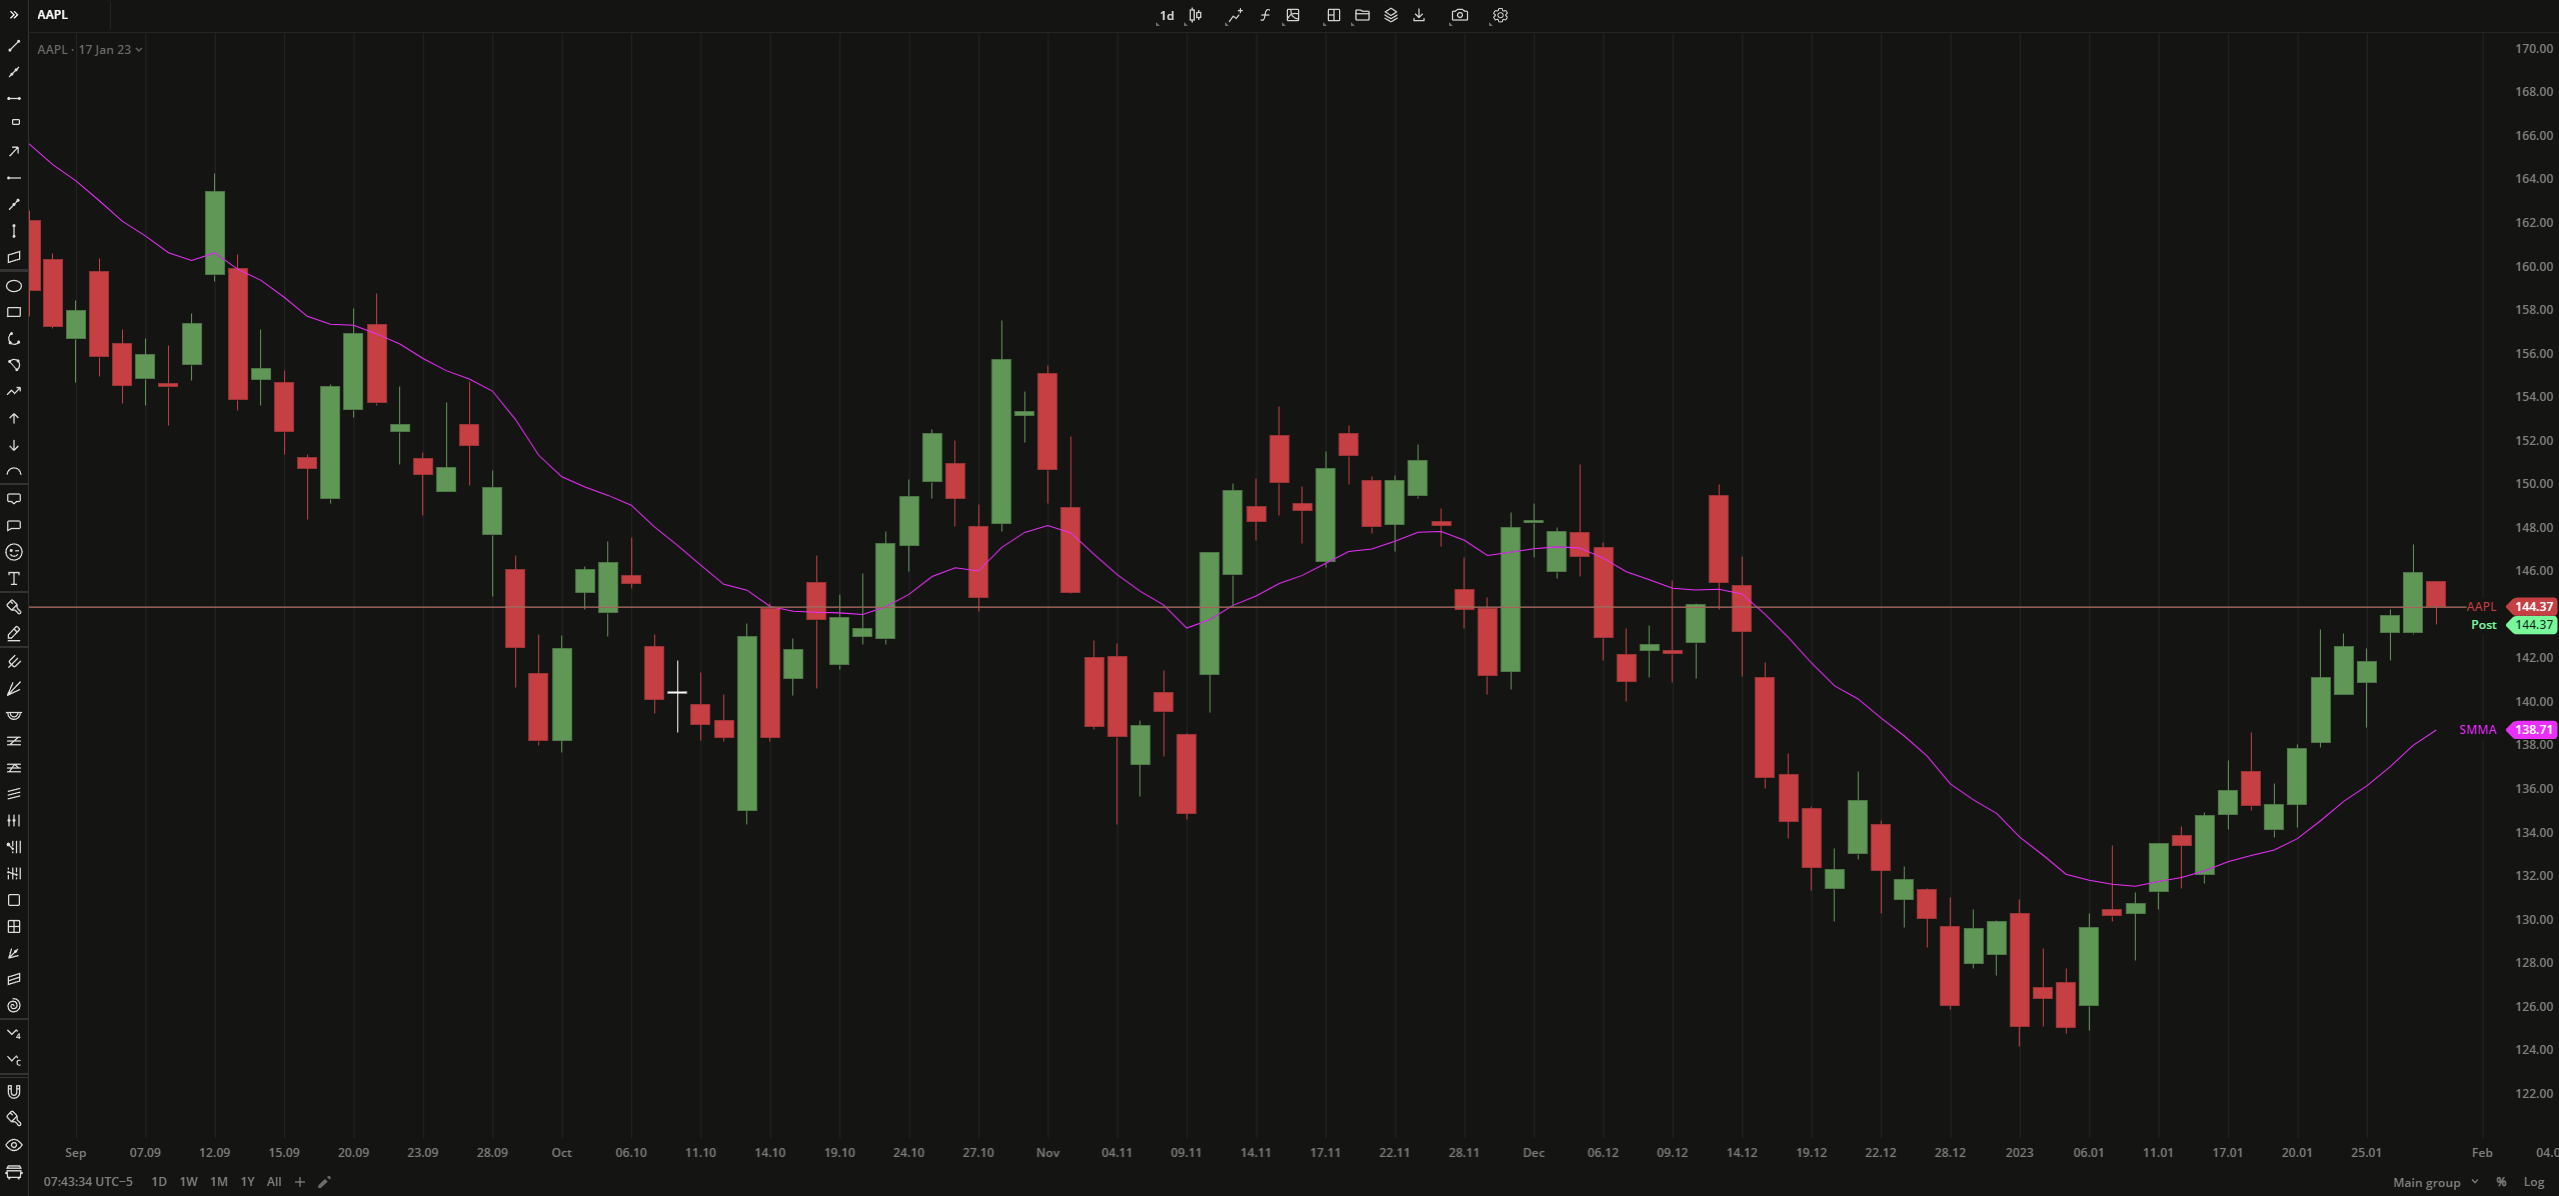 Smoothed Moving Average
INPUTS
| Price |
|---|
The following data sources are available for the price:
|
| Input | Description |
|---|---|
| Length | The number of bars used to calculate EMA |
| Displace | The number of bars the indicator to be shifted to |
PLOTS
The plot renders the data you are working with on the chart. You can show/hide a plot by clicking the corresponding item in the settings. Every plot has a set of basic settings that you can change: color, weight, and type.
| Plot | Description |
|---|---|
| SMMA | The SMMA plot |
| Color |
|---|
Click the color rectangle under the plot's name to open the palette. Use the slider at the bottom to set the opacity of the color.  Palette To create a custom color:
The custom-created colors are added to your palette. To remove a custom color, drag it out of the palette. |
| Weight |
| Change the value (in px) to adjust the thickness of the plot. |
| Type |
The following plot types are available:
|
 to open the color picker
OVERLAYING
Check Overlaying to display the indicator on the chart. Otherwise, the indicator is shown in a study pane down below.