
Spearman is a trend confirmation oscillator that is based on the Spearman's coefficient. The coefficient is used to determine correlation between actual price movements and the current trend i.e. the oscillator shows the strength of prevailing trend. The oscillator then plots a Spearman's line and its smoothed with SMA version (SpearmanAverage). The both lines oscillate above or below the zero level on the scale from -100 to +100. The Spearman's line above 80 suggests an uptrend whereas the Spearman's line below -80 indicates a downtrend. Crossover between both Spearman and SpearmanAverage can indicate possible reversal points while crossing above or below zero level might be a signal to buy or sell respectively.
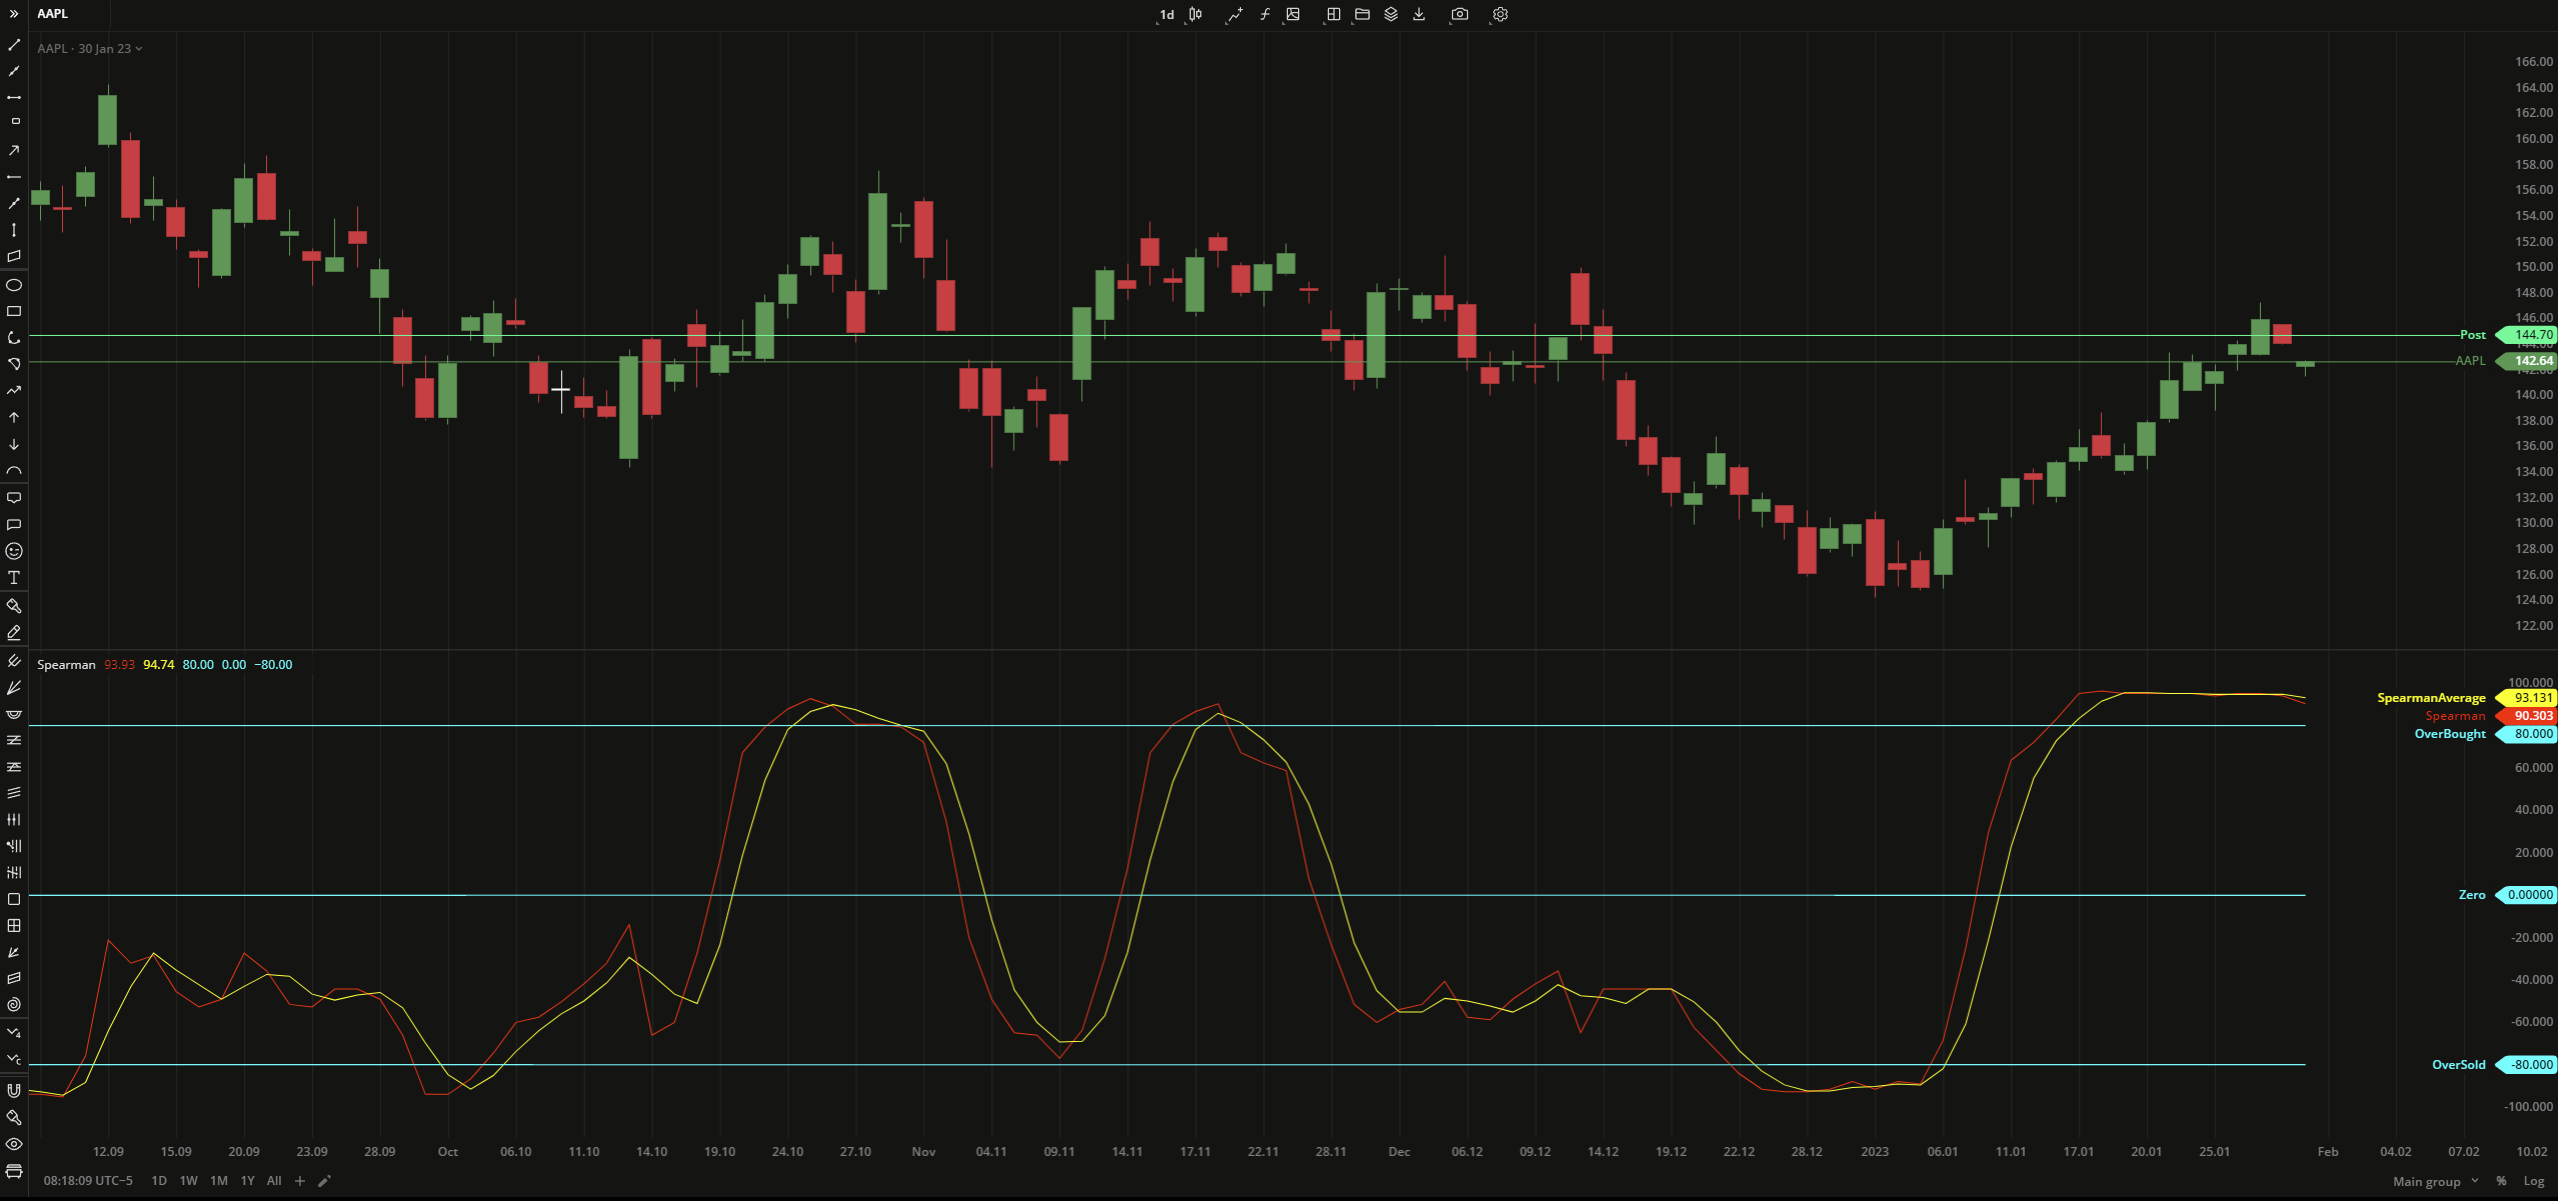 Spearman
INPUTS
| Price |
|---|
The following data sources are available for the price:
|
| Input | Description |
|---|---|
| Length | The number of bars used to calculate Spearman |
| AverageLength | The number of bars used to calculate the SMA of Spearman |
| Overbought | The price to fix the overbought level at |
| Oversold | The price to fix the oversold level at |
PLOTS
The plot renders the data you are working with on the chart. You can show/hide a plot by clicking the corresponding item in the settings. Every plot has a set of basic settings that you can change: color, weight, and type.
| Plot | Description |
|---|---|
| Spearman | The Spearman plot |
| SpearmanAverage | The SMA of Spearman indicator |
| Overbought | The overbought level |
| Zero | The zero level |
| Oversold | The oversold level |
| Color |
|---|
Click the color rectangle under the plot's name to open the palette. Use the slider at the bottom to set the opacity of the color. 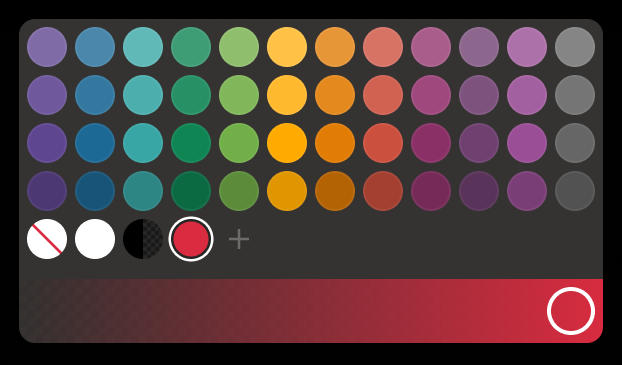 Palette To create a custom color:
The custom-created colors are added to your palette. To remove a custom color, drag it out of the palette. |
| Weight |
| Change the value (in px) to adjust the thickness of the plot. |
| Type |
The following plot types are available:
|
 to open the color picker
OVERLAYING
Check Overlaying to display the indicator on the chart. Otherwise, the indicator is shown in a study pane down below.