
TD Sequential is an indicator that helps identify uptrend/downtrend exhaustion or potential reversal price points. The indicator comprises two price sequences – TD Setup (the first one) which is a prerequisite for the TD Countdown (the second sequence). The TD Setup sequence is calculated as the difference between the current Close and the corresponding Close four bars earlier. TD Setup is considered completed after it takes 9 consecutive bars in a row, that means the reversal is about to take place. Then, the TD Countdown sequence starts. It is calculated as the difference between the current Close with the low/high two bars earlier. The TD Countdown sequence is considered completed after it takes 13 consecutive bars in a row, that also may indicate an upcoming price reversal.
TD Setup = Closen - Closen-4
TD Countdown = Closen - Low/Highn-2
where:
n – calculation period

TD Sequential
INPUTS
Input | Description |
|---|---|
SetupBarLength | The number of consecutive bars in the TD Setup sequence |
CountdownBarLength | The number of consecutive bars in the TD Countdown sequence |
CountdownStartFromIndex | The index number the countdown starts from |
PLOTS
The plot renders the data you are working with on the chart. You can show/hide a plot by clicking the corresponding item in the settings. Every plot has a set of basic settings that you can change: color, weight, and type.
Plot | Description |
|---|---|
SetupBuy | The sequence of bars where bar is taken if Close (today) < Close (4 bars earlier) |
SetupSell | The sequence of bars where bar is taken if Close (today) > Close (4 bars earlier) |
CountdownBuy | The sequence of bars where bar is taken if Close (today) ≤ Low (2 bars earlier) |
CountdownSell | The sequence of bars where bar is taken if Close (today) ≥ High (2 bars earlier) |
PerfectSetupBuy | Highlightes the candle (by default) on the chart after SetupBuy sequence is completed |
PerfectSetupSell | Highlightes the candle (by default) on the chart after SetupSell sequence is completed |
Support | The support level |
Resistance | The ressistance level |
CountdownBuyPlus | Shows pluses on the chart as a number of bars indicating potential buying opportunity happened after a PerfectSetupSell |
CountdownSellPlus | Shows pluses on the chart as a number of bars indicating potential selling opportunity happened after a PerfectSetupBuy |
SetupTriangle | Adds triangles for the SetupBuy and SetupSell sequences on the chart |
PerfectCountdownBuy | By default shows "B mark" on the chart after CountdownBuy sequence is completed |
PerfectCountdownSell | By default shows "S mark" on the chart after CountdownSell sequence is completed |
BuySetupArrow | The arrow indicating a completed SetupBuy sequence on the chart which is a potential buying opportunity |
SellSetupArrow | The arrow indicating a completed SetupSell sequence on the chart which is a potential selling opportunity |
Color |
|---|
Click the color rectangle under the plot's name to open the palette. Use the slider at the bottom to set the opacity of the color. 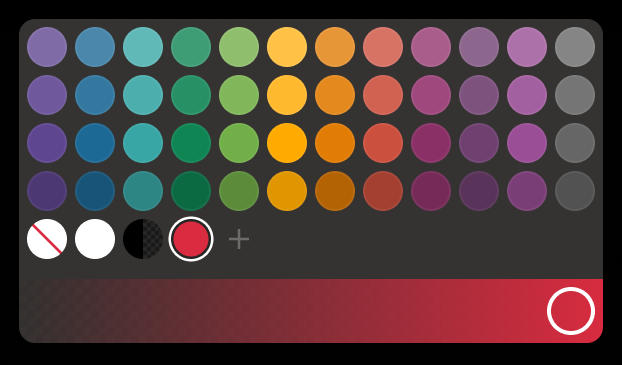 Palette To create a custom color:
The custom-created colors are added to your palette. To remove a custom color, drag it out of the palette. |
Weight |
Change the value (in px) to adjust the thickness of the plot. |
Type |
The following plot types are available:
|
 to open the color picker
OVERLAYING
Check Overlaying to display the indicator on the chart. Otherwise, the indicator is shown in a study pane down below.
Note: To reset the settings, click Restore to Default next to the SETTINGS: INDICATOR'S TITLE