DXcharts Web
- DarkLight
DXcharts Web
- DarkLight
Article summary
Did you find this summary helpful?
Thank you for your feedback!
(11).webp)
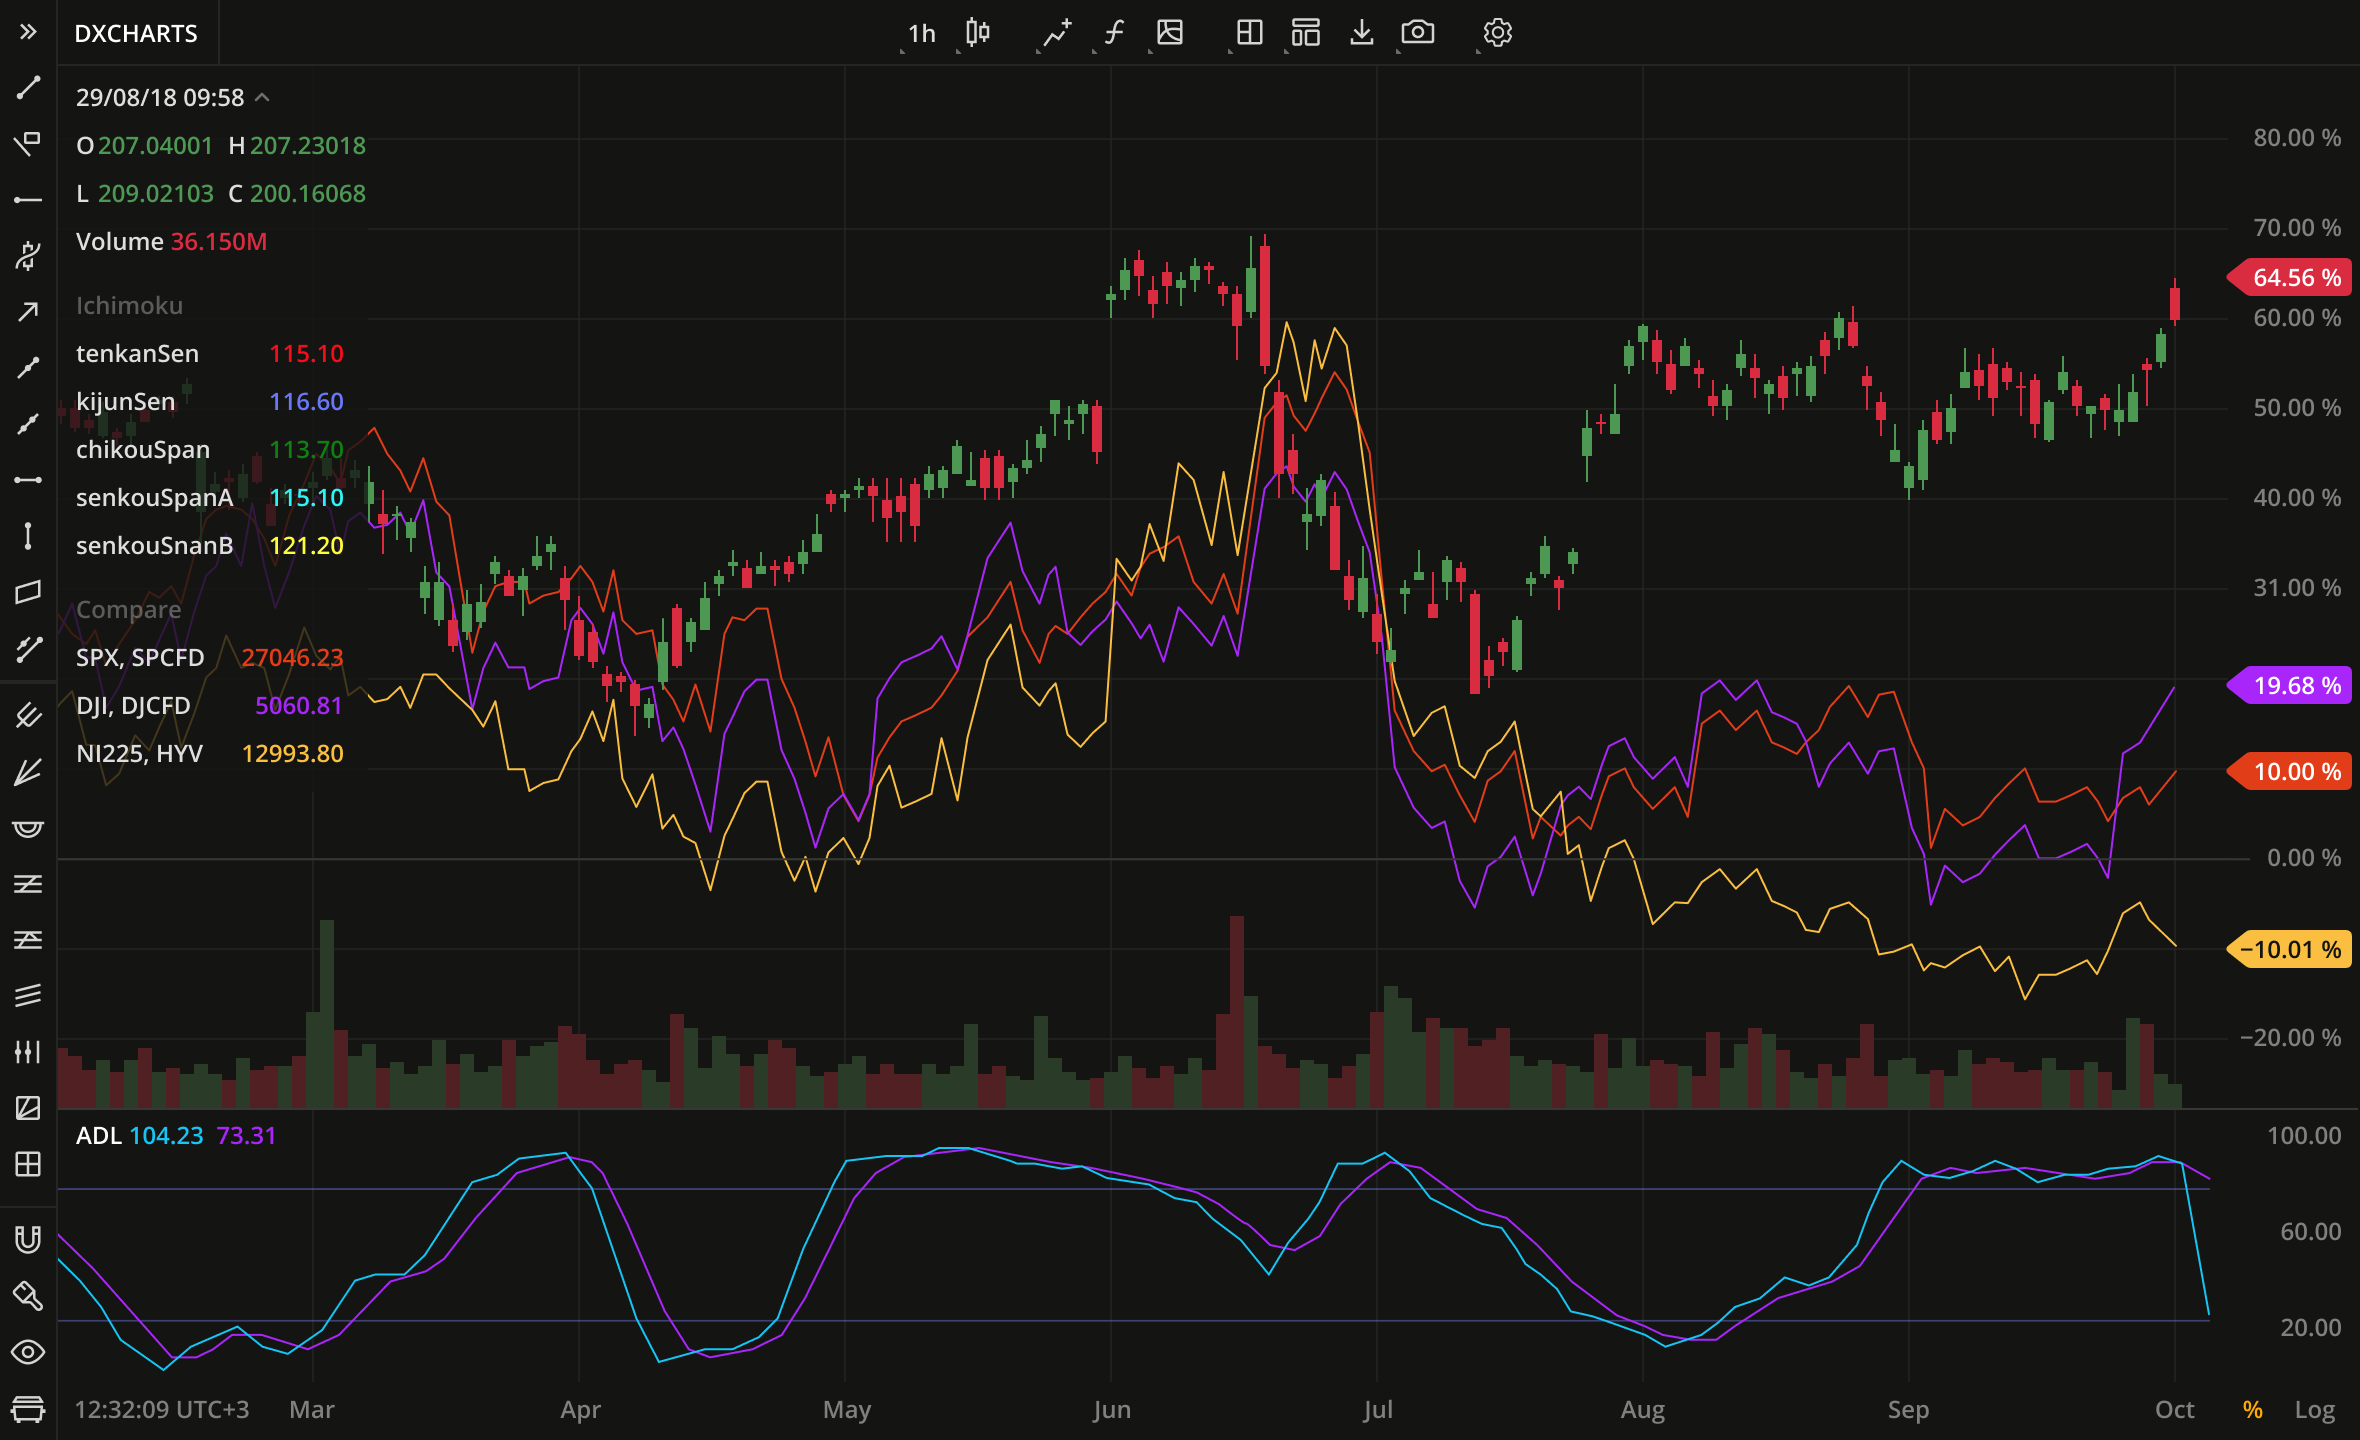
DXcharts knowledge base. Learn charting with how-to-use articles and useful tips
DXcharts is a charting package with 100+ technical indicators, a wide selection of drawings, and chart types in-depth technical analysis. The trading-from-the chart functionality, multiple charts layout, price scale configuration, custom aggregation periods and presets, and other handy features are available for day or swing trading.
 DXcharts web
Was this article helpful?