Aggregation period
- DarkLight
Aggregation period
- DarkLight
Article summary
Did you find this summary helpful?
Thank you for your feedback!

Overview
DXcharts mobile has all the standard aggregation periods with the ability to customize them. You can either use the predefined (default) aggregations or create your own custom aggregations.
- Find and tap the Aggregation period
 icon on the Tools panel on the main screen. The icon shows the currently selected aggregation period.
 - Select any required predefined aggregation to aplly it to the chart or tap Create custom.
.png) Tools panel
Tools panel
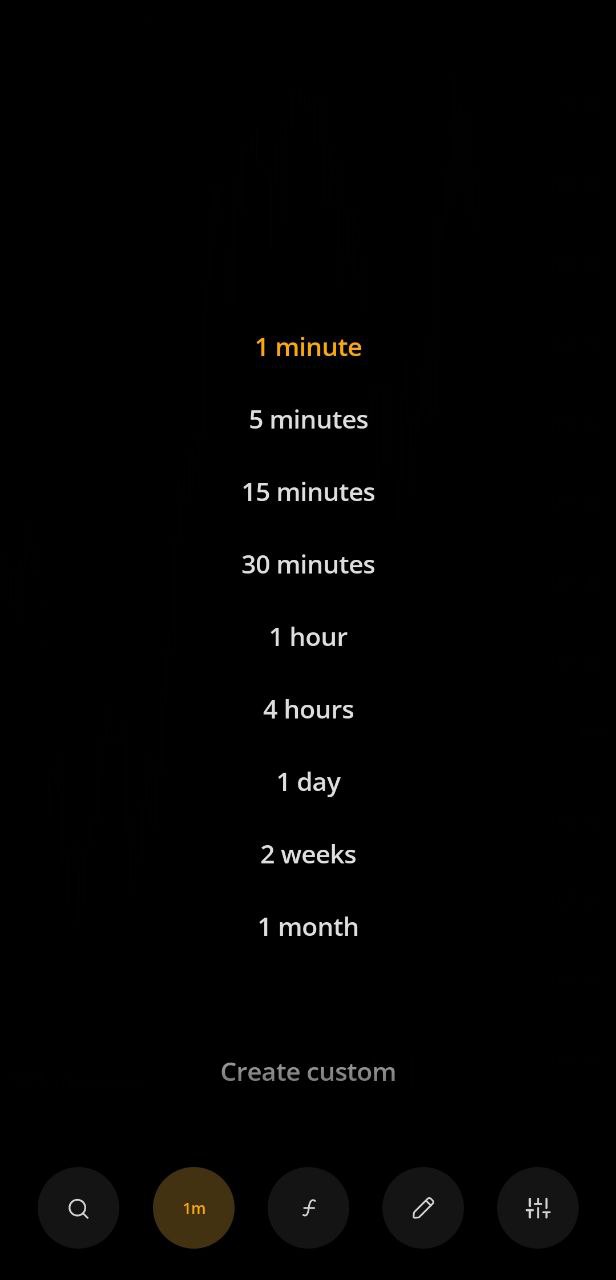 Predefined aggregations
Custom aggregation period
For a custom aggregation period, you can manually specify how much data to aggregate into a single bar. In other words, you can adjust for a bar the number of time units it should aggregate: seconds, minutes, hours, weeks, and so on.
To create a custom aggregation period:
- Tap Create custom at the bottom of the list with all aggregations to open the screen for adding custom aggregations.
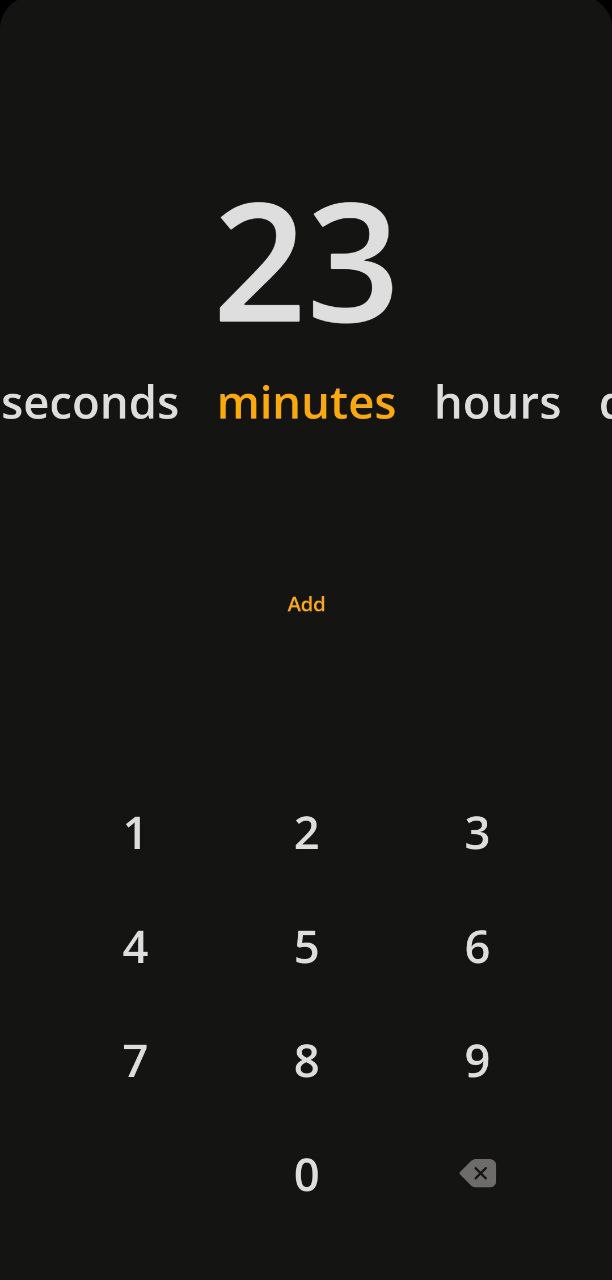 Adding custom aggregations
 - Set the time units by scrolling left or right and input the required number for the aggregation.
- Then tap Add – the aggregation will be apllied to the current chart.
Note: To delete an aggregation period, swipe left on the required aggregation. The currently selected aggregation can't be deleted.
Time ranges
In addition to aggregation periods, which are aggregations of data for a bar, there are also time ranges for quick access – the time intervals with predefined aggregations for which the entire chart is plotted.
The time ranges are displayed when you pinch the main screen or fast scroll. Each time range corresponds to a specific aggregation period:
- 1 day - 1 minute
- 1 week - 5 minutes
- 1 month - 30 minutes
- 3 months - 1 day
- 6 months - 1 day
- YTD (Year to Date) - 1 week
- All - 1 month
.jpg) Time ranges
Time rangesWas this article helpful?