Area
- DarkLight
Area
- DarkLight
Article summary
Did you find this summary helpful?
Thank you for your feedback!
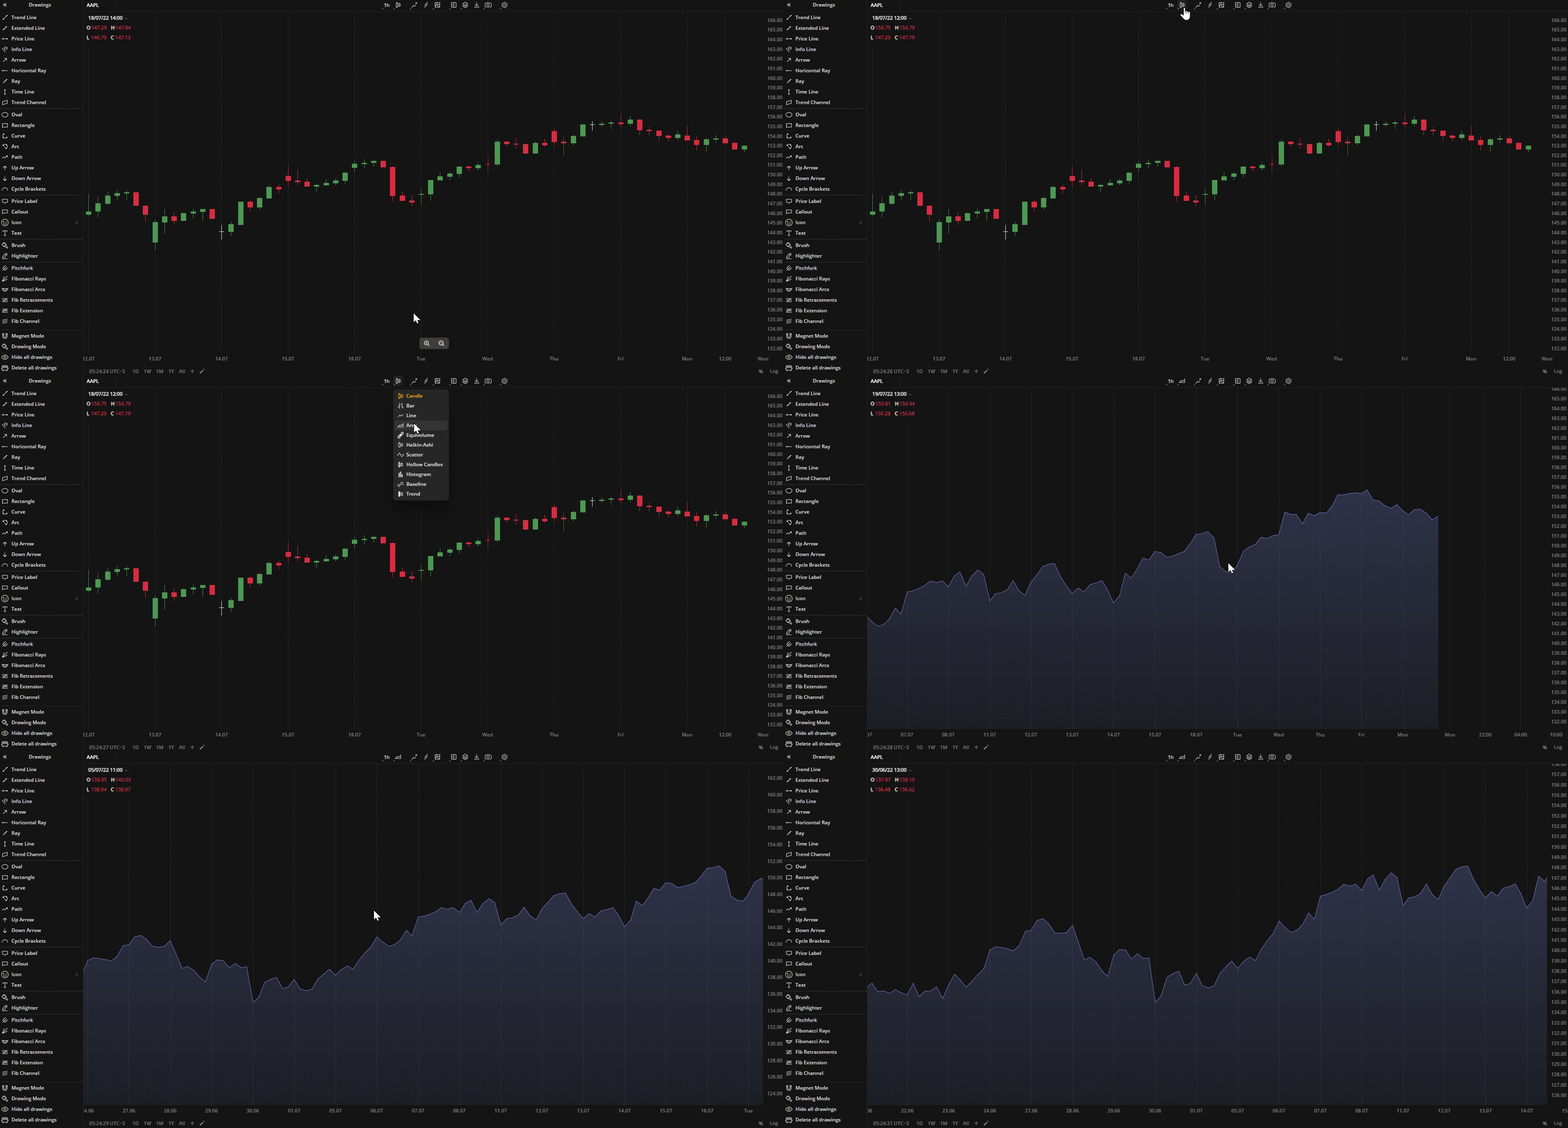
The Area chart is plotted using the Close price values and displays the area between the current Close price and the zero price level. The area is color-filled to allow users a clearer view of the trend.
 Area Chart
 You can select alternative colors for the chart in Settings![]() > Colors
> Colors![]() .
.
Was this article helpful?


(17).webp)