Average Directional Movement Index (ADX)
- DarkLight
Average Directional Movement Index (ADX)
- DarkLight
Article summary
Did you find this summary helpful?
Thank you for your feedback!

Average Directional Movement Index (ADX) is an indicator that measures the overall strength of a trend. Being a component of the Directional Movement System, ADX combines and smooths (by Moving Average) the result of two other indicators: the positive directional indicator (DMI+) and negative directional indicator (DMI-). The indicator line fluctuates in the range from 0 to +100, whereby the readings below 20 indicate trend's weakness, and readings above 40 indicate trend's strength.
ADX = MAi x [ |DMI(+) - DMI(-)| / (DMI(+) + DMI(-)] x 100
where:
MAi – the Moving Average value calculated for the period
DMI(+) – the positive Direction Movement Index value calculated for the period
DMI(+) – the negative Direction Movement Index value calculated for the period
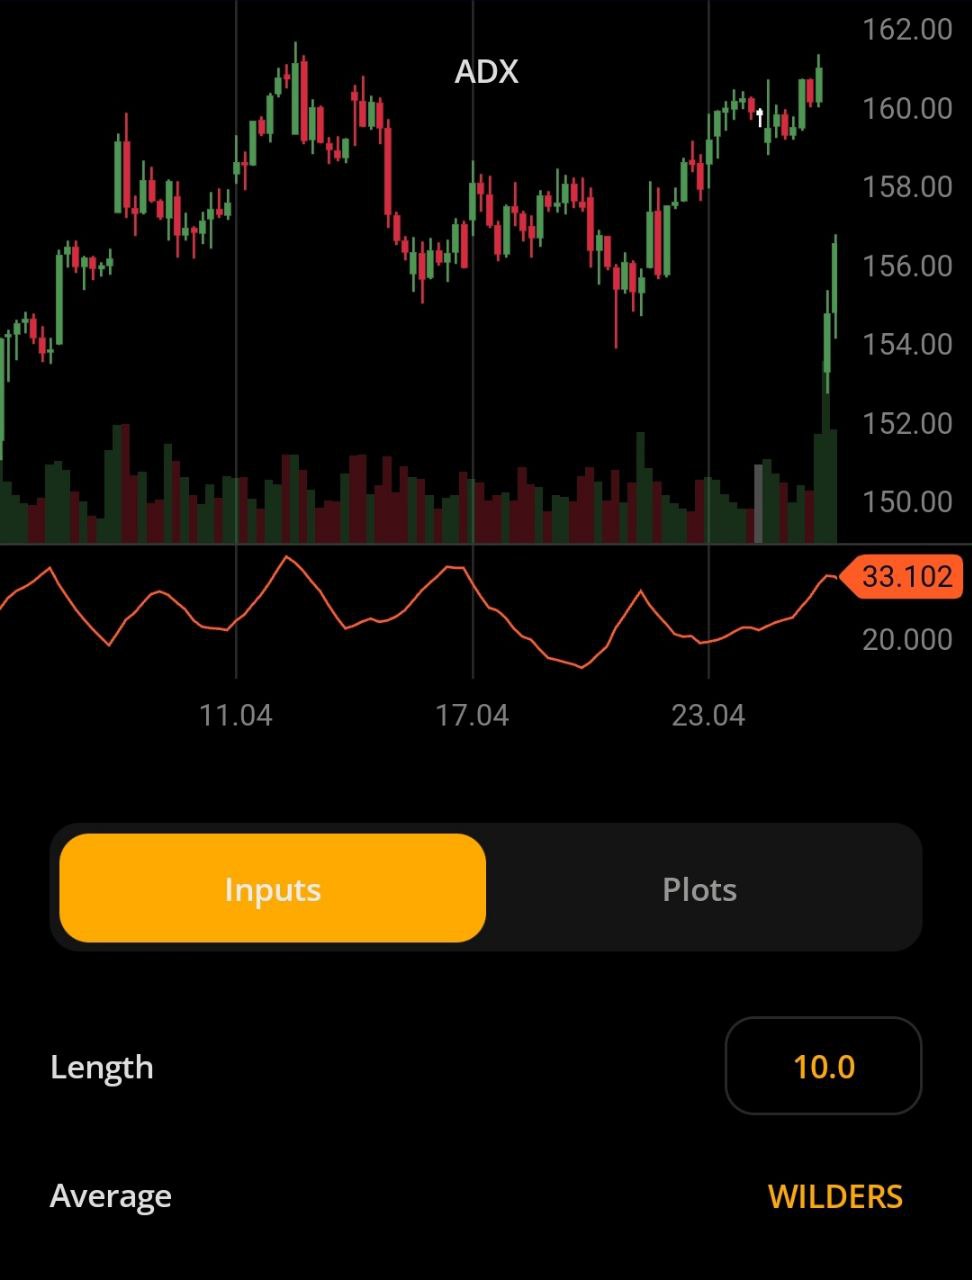 Average Directional Movement Index
INPUTS
| Input | Description |
|---|---|
| Length | The number of periods the indicator uses to calculate the ADX plot |
To change the input do the following:
- Tap on the numbers to display the slider bar.
- Use the slider to change the value and tap on the numbers again to apply.
- Swipe left or right or tap the back
.png) icon to return to the previous screen.
icon to return to the previous screen.
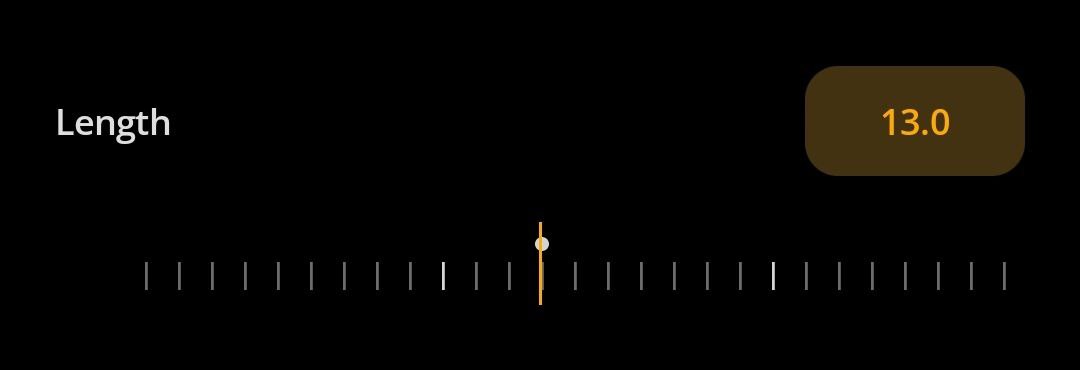 Adjusting the input
| Average |
|---|
The following Moving Average types are available for calculations:
|
PLOTS
The plot renders the data you are working with on the chart. Each plot has two basic parameters that you can change: color and type.
| Plot | Description |
|---|---|
| ADX | The Average Directional Movement Index plot |
| Color |
|---|
Tap the icon 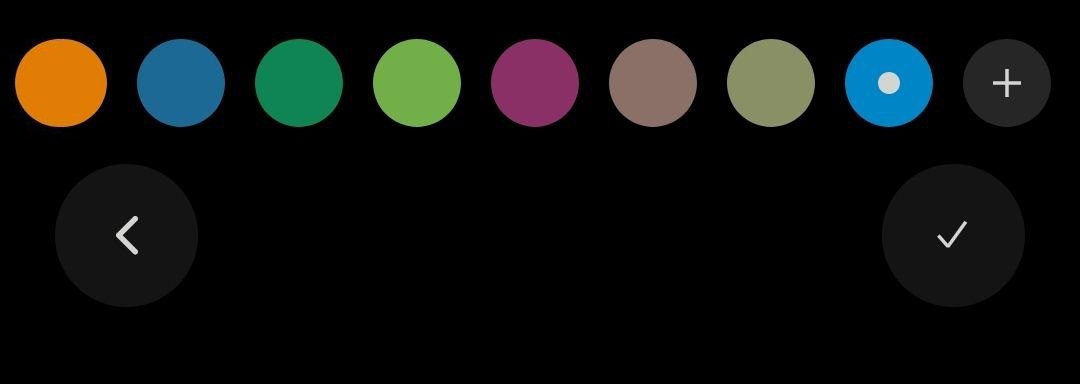 Color picker Color pickerTo create a custom color:
Note: To remove a color, tap and hold the color circle in the Color picker, then select Delete. The currently selected color can't be deleted. |
| Type |
The following plot types are available:
|
 to open the palette.
.png) to apply and save the color or tap
to apply and save the color or tap to return to parameters.
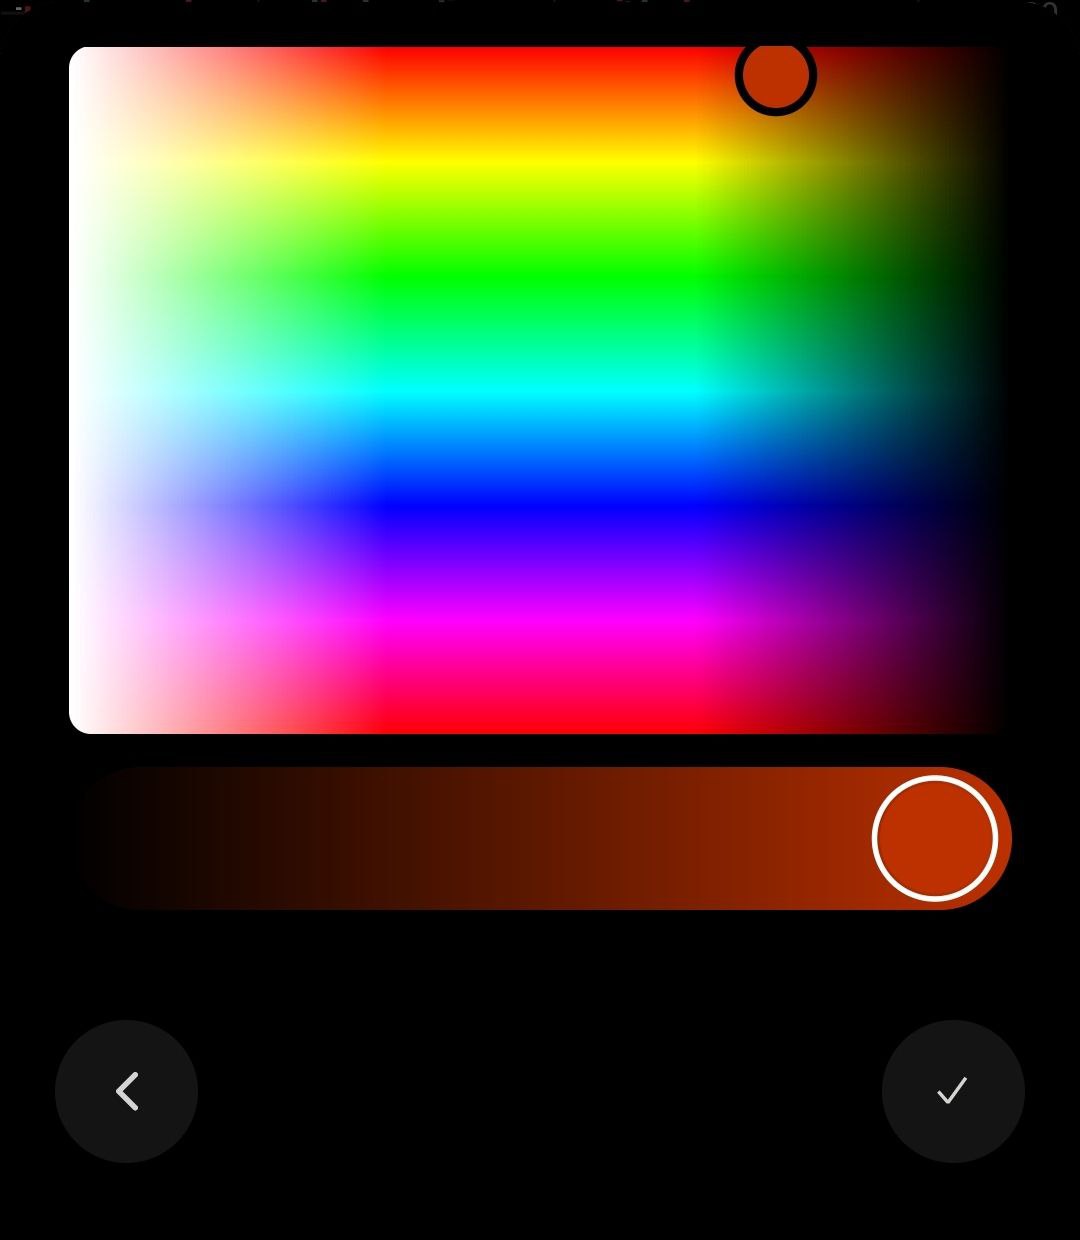
Note: Tap Reset to return the indicator to the default settings
Was this article helpful?