Histogram
- DarkLight
Histogram
- DarkLight
Article summary
Did you find this summary helpful?
Thank you for your feedback!
(22).webp)
The Histogram chart is similar to the Area chart but the distance between Close price values and the horizontal price axis is displayed as a series of columns. You can use the Histogram chart to identify distribution of peaks and visualize distribution patterns.
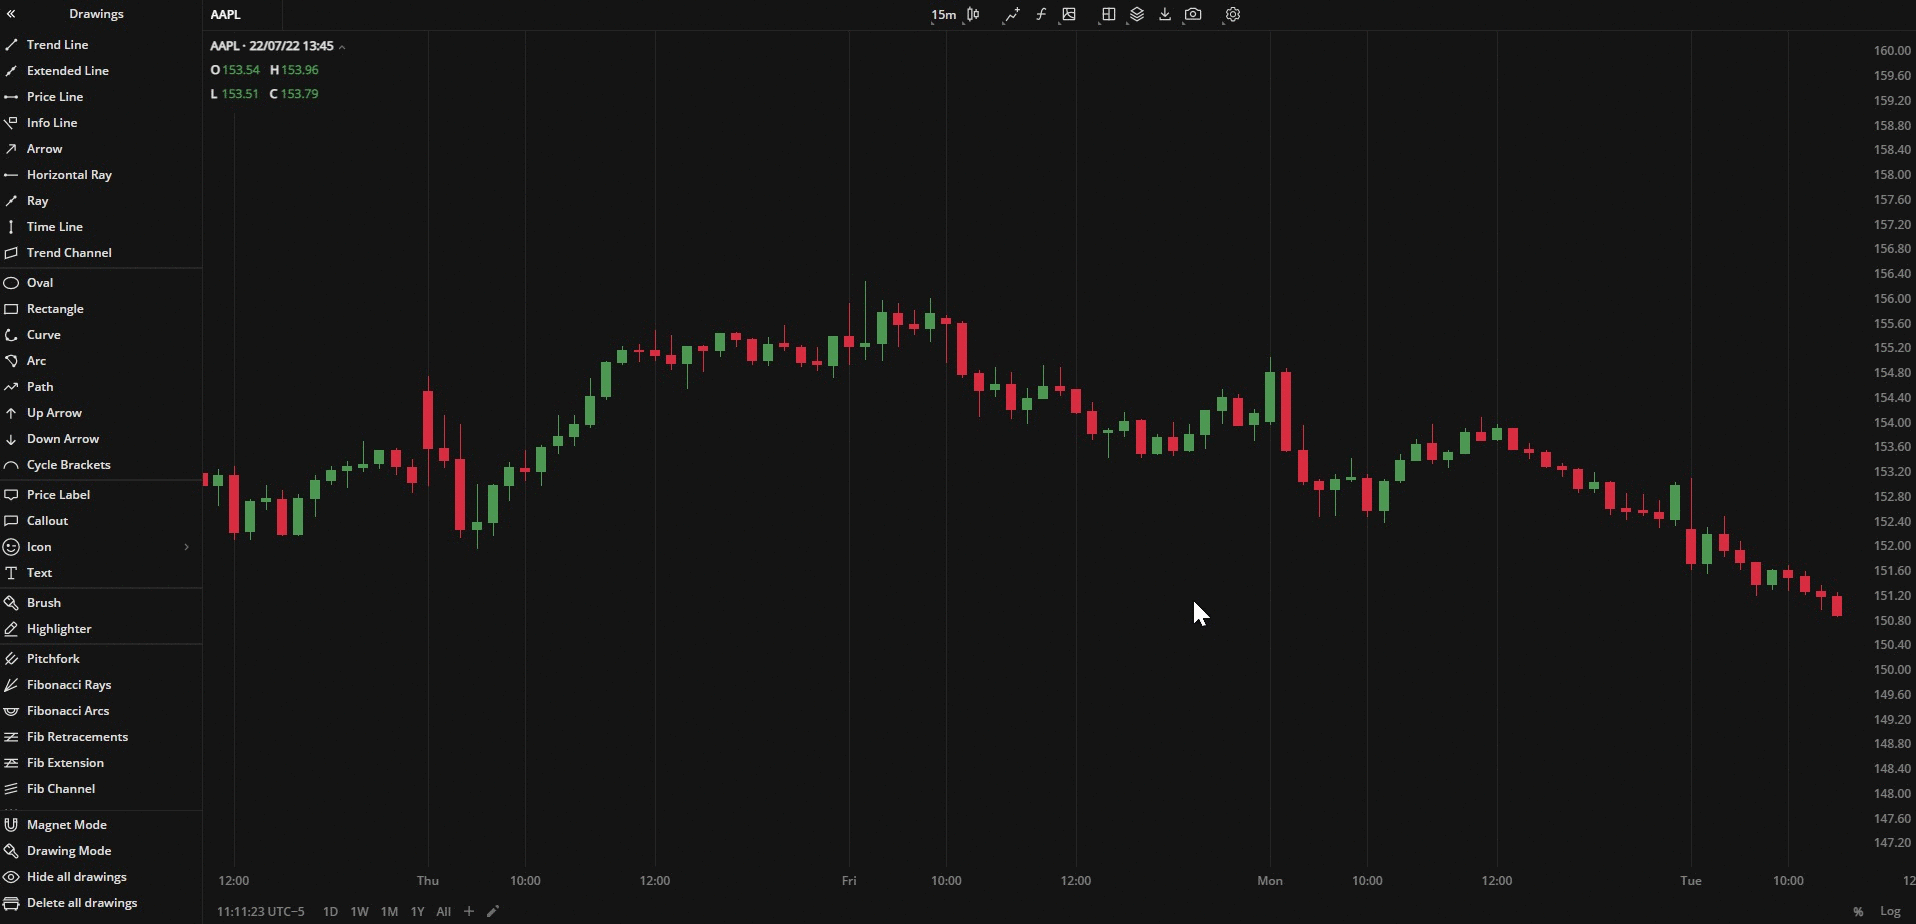 Histogram chart
Coloring
The Histogram columns are colored depending on whether the current Close price is greater or lower than the current Open price.
- Close price > Open price - the column is "up-colored" (green by default)
- Close price < Open price - the column is "down-colored" (red by default)
- Close price = Open price - the column is "neutral-colored" (white by default)
You can select alternative colors for the columns in Settings![]() > Colors
> Colors![]() .
.
Was this article helpful?