Historical Volatility (HV)
- DarkLight
Historical Volatility (HV)
- DarkLight
Article summary
Did you find this summary helpful?
Thank you for your feedback!

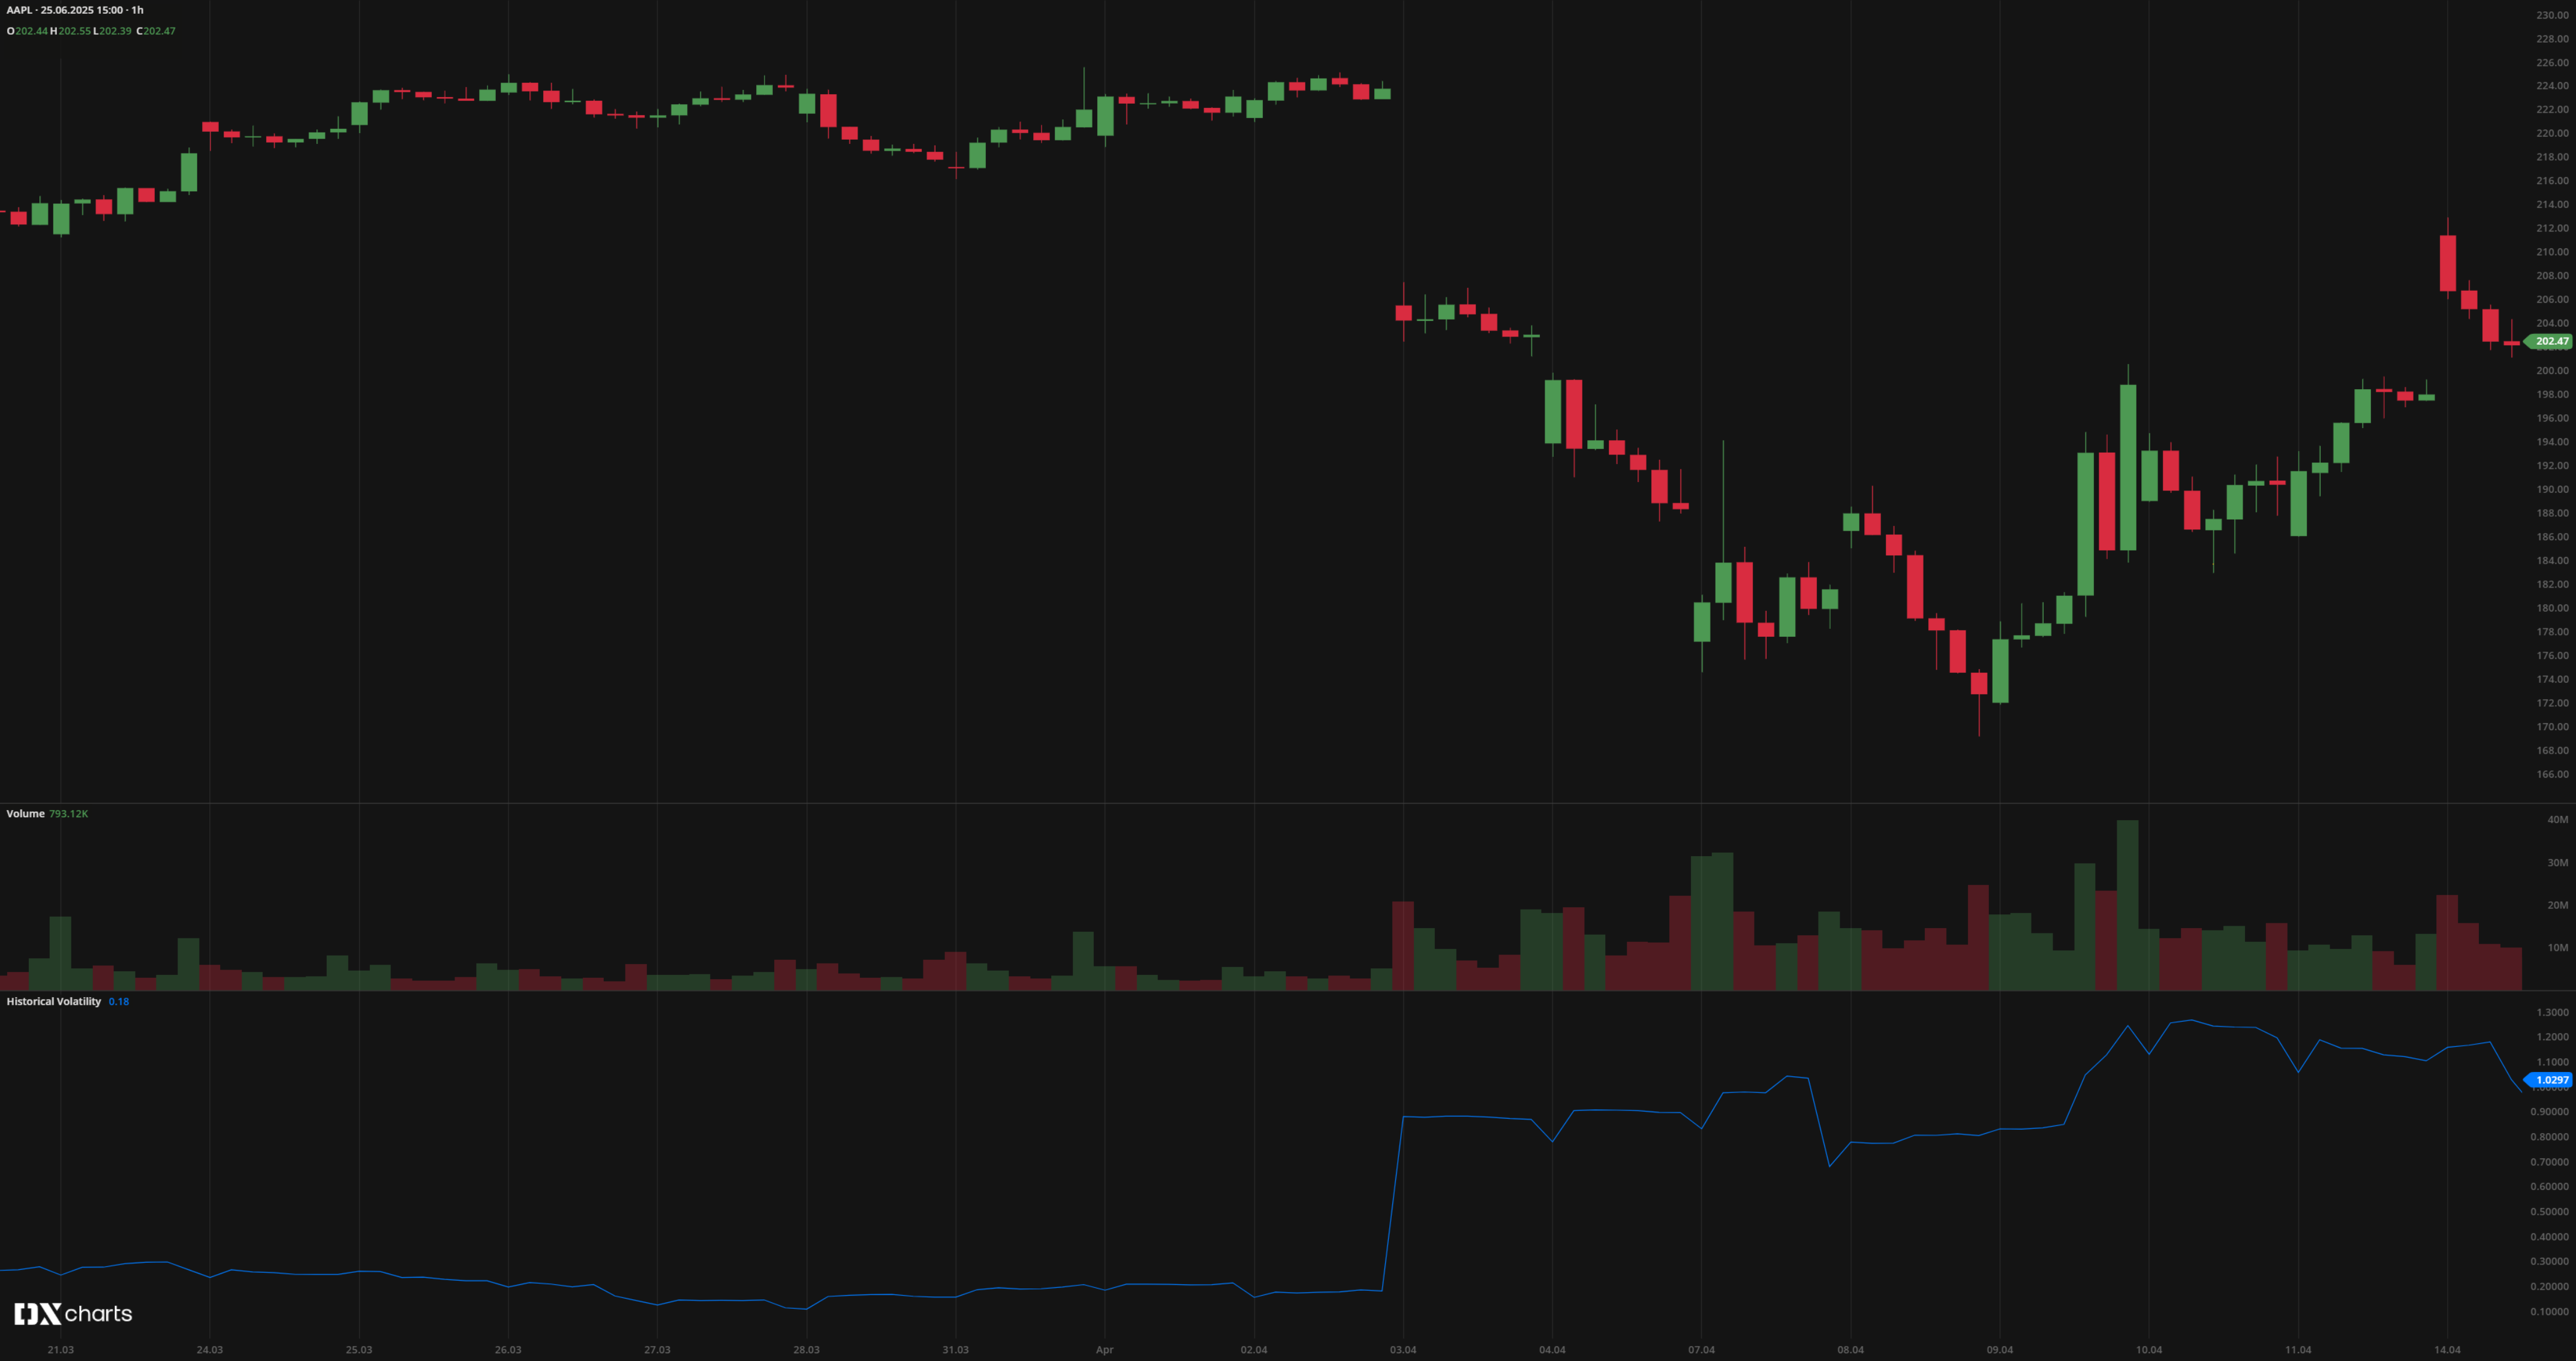
Historical Volatility (HV) measures the price dispersion of a security over a specified time period. It reflects the degree of past price fluctuations and provides insight into the asset's historical risk profile. HV is expressed as an annualized percentage and is derived from the standard deviation of relative price changes, measured using the natural logarithm, to estimate daily volatility. This value is then annualized according to the selected aggregation period.
1. To calculate HV, the relative price change is measured as the natural logarithm of the ratio between the current and previous price values.
2. The average return is then calculated based on these logarithmic price changes.
3. Standard deviation is used to measure how much the returns deviate from the mean, producing the daily volatility.
4. The daily volatility is converted into an annualized value by multiplying it by the square root of the number of periods in a year, based on the selected aggregation period.
5. The final Historical Volatility (HV) is obtained by applying this annualized scaling directly to the standard deviation.
where:
Pi – the price on the chosen period i
Pi-1 – the price on the previous period
n – the total number of the chosen period
T – aggregation period
| Aggregation period (T) | |
|---|---|
| Month | 12 |
| Week | 52 |
| Day | 252 |
| Hour | 1,764 (252 trading days × 7 hours) |
| Minute | 105,840 (252 × 7 × 60) |
| Second | 6,350,400 (252 × 7 × 60 × 60) |
 Historical Volatility (HV)
INPUTS
| Input | Description |
|---|---|
| Basis | Annualization method. Available options: Annual, Monthly, Weekly, Daily |
| Length | The number of bars used to calculate the HV |
PLOTS
The plot renders the data you are working with on the chart. You can show/hide a plot by clicking the corresponding item in the settings. Every plot has a set of basic settings you can change: color, weight, and type.
| Plot | Description |
|---|---|
| HV | The Historical Volatility plot |
| Color |
|---|
Click the color rectangle under the plot's name to open the palette. Use the slider at the bottom to set the opacity of the color.  Palette To create a custom color:
The custom-created colors are added to your palette. To remove a custom color, drag it out of the palette. |
| Weight |
| Change the value (in px) to adjust the thickness of the plot. |
| Type |
The following plot types are available:
|
OVERLAYING
Check Overlaying to display the indicator on the main chart. Otherwise, the indicator is shown in a study pane down below.
Note: To reset the settings, click Restore to Default next to the SETTINGS: INDICATOR'S TITLE