Ichimoku (ICH)
- DarkLight
Ichimoku (ICH)
- DarkLight
Article summary
Did you find this summary helpful?
Thank you for your feedback!

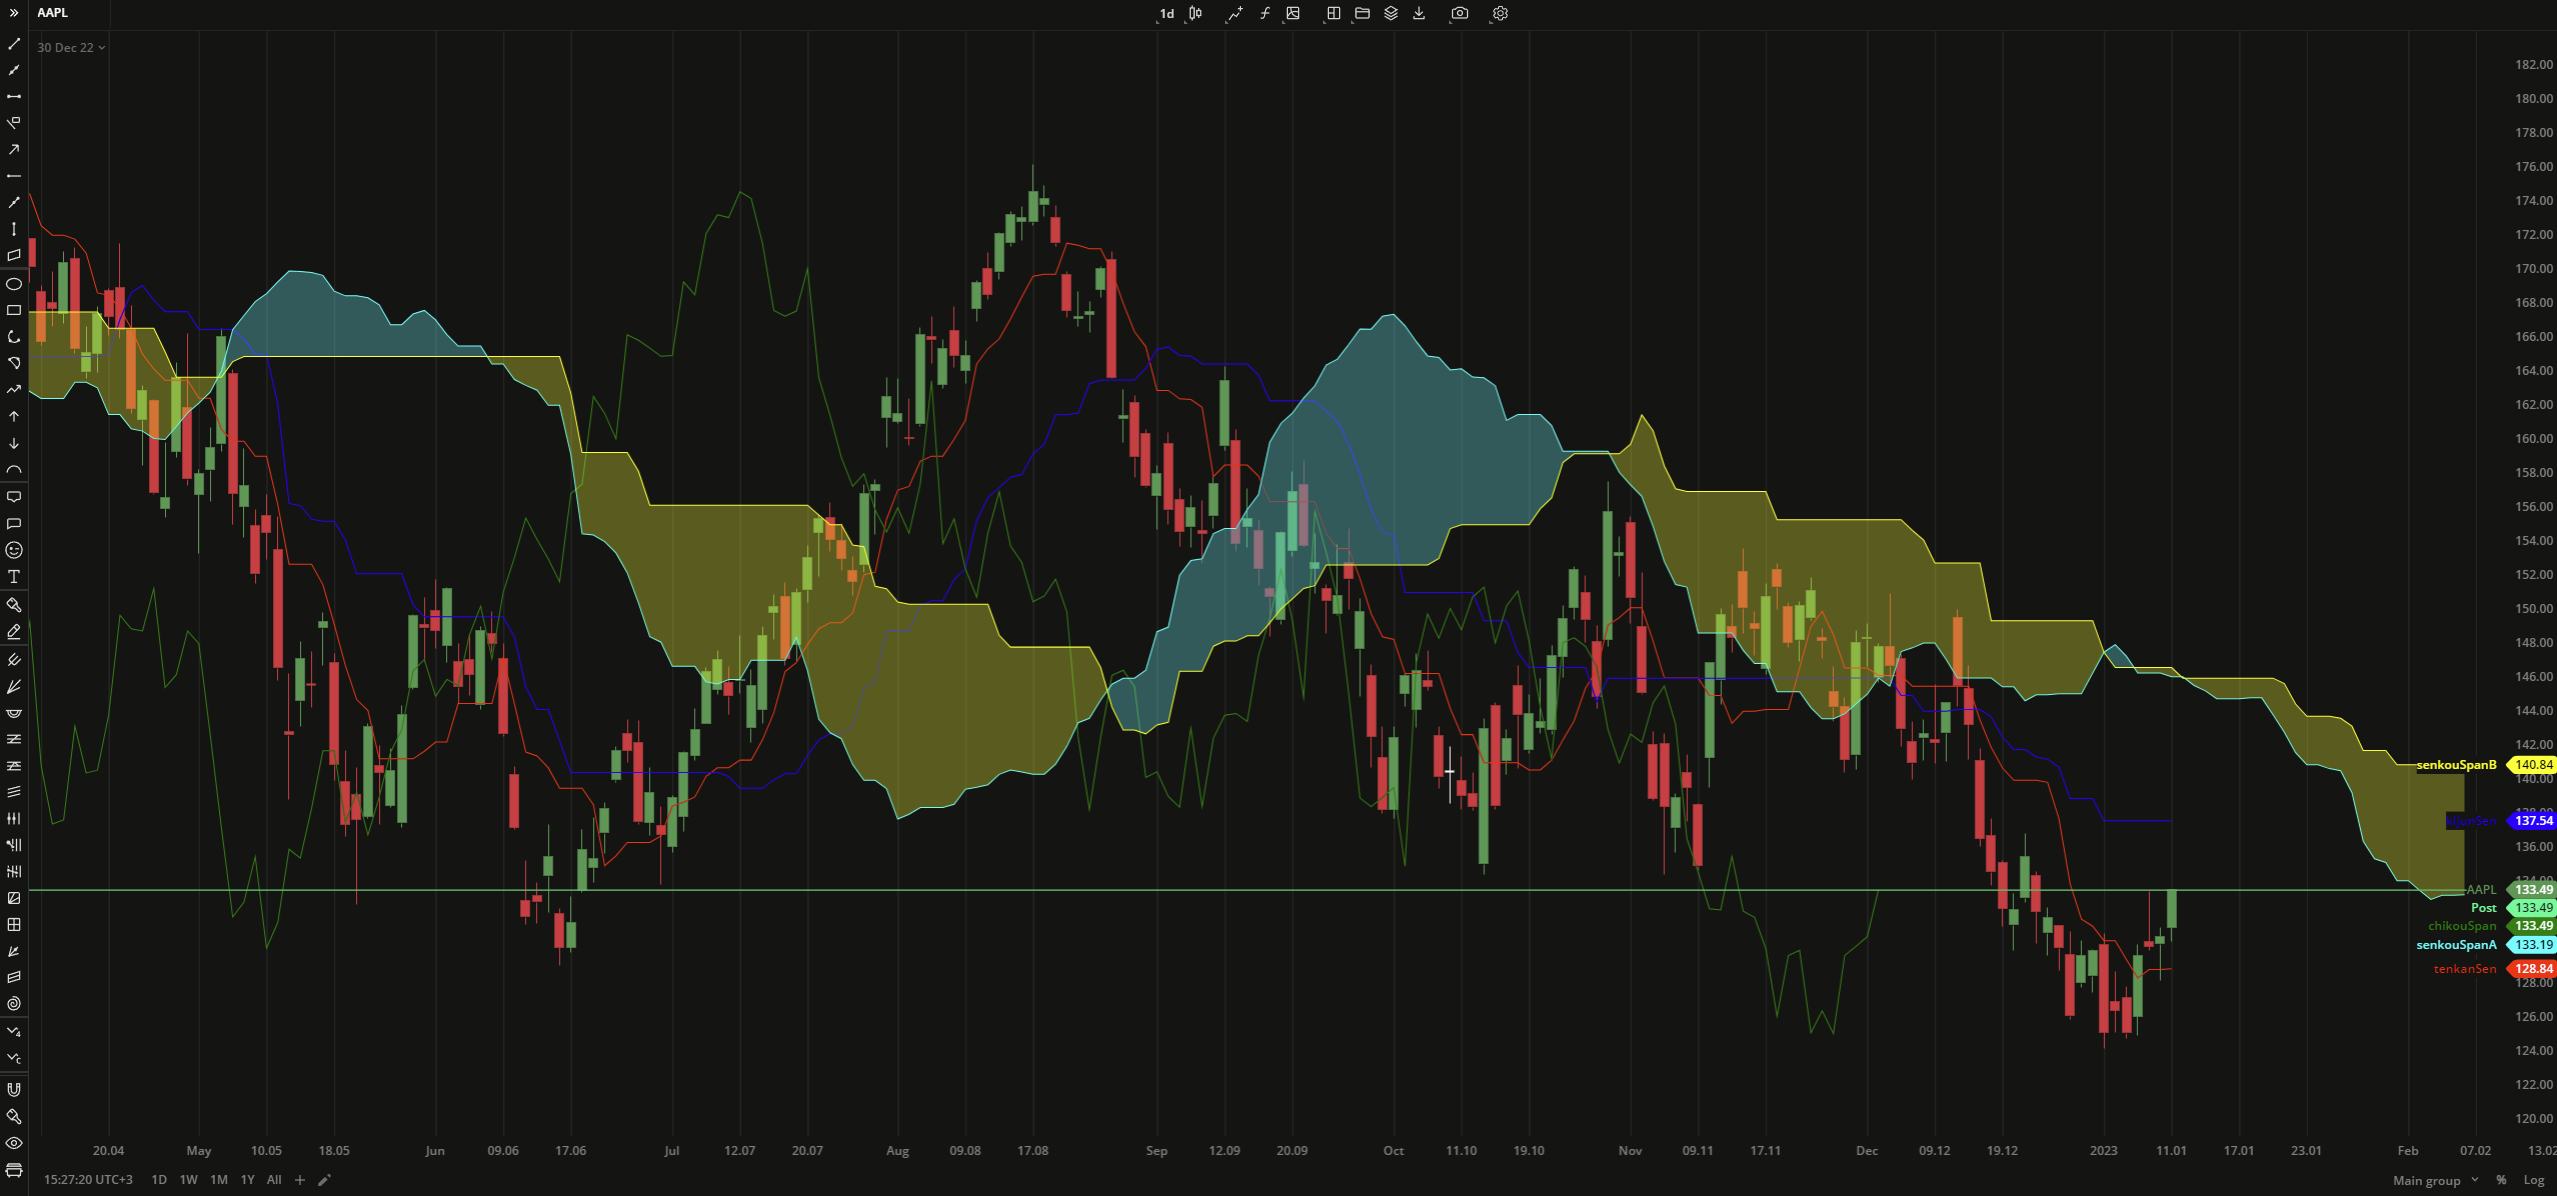
The Ichimoku (ICH) is a technical analysis indicator that provides a complete picture of the market setup. It is used to monitor the market momentum, define the support and resistance levels, and detect price trend: the direction and strength. The indicator consists of the following plots:
- TenkanSen (conversion or turning line) - trend indicator, the most sensitive 9-period moving average of the Ichimoku lines.
- KijunSen (baseline) - trend indicator, a 26-period moving average.
- ChikouSpan (lagging line) - moving average of the TenkanSen and KijunSen indicators.
- SenkouSpanA (leading line A) - 52-period moving average.
- SenkouSpanB (leading line B) - close price plotted 26 periods back.
The KijunSen and TenkanSen lines help identify the trend and its direction respectively: when the price is above KijunSen, prices will likely keep going up, and vice versa. A buy signal is generated when the ChikouSpan line crosses over the price, or when the TenkanSen crosses over the KijunSen. A sell signal is generated when the ChinkouSpan line crosses under the price, or when the TenkanSen crosses under the KijunSen. The price movement can be confirmed when both crosses occur.
The SenkouSpanA and SenkouSpanB lines show expected trend behavior and can be used as support and resistance levels. The space between them is called Cloud, and is graphed in a hatched pattern.
TenkanSen = (9-PH + 9-PL) / 2
KijunSen = (26-PH + 26-PL) / 2
ChikouSpan = Close plotted 26 periods in the past
SenkouSpanA = (CL + Base Line) / 2
SenkouSpanB = (52-PH + 52-PL) / 2
where:
PH – Period high
PL – Period low
CL – Conversion line
 Ichimoku
INPUTS
| Input | Description |
|---|---|
| TenkanPeriod | The number of bars used to calculate the TenkanSen plot |
| KijunPeriod | The number of bars used to calculate KijunSen, ChikouSpan, SenkouSpanA, SenkouSpanB |
PLOTS
The plot renders the data you are working with on the chart. You can show/hide a plot by clicking the corresponding item in the settings. Every plot has a set of basic settings that you can change: color, weight, and type.
| Plot | Description |
|---|---|
| TenkanSen | The Tenakan plot used as a signal line |
| KijunSen | The Kijun plot used as a confirmation line |
| ChikouSpan | The Chikou plot used as a suppor/resistance line |
| SenkouSpanA | The Senkou SpanA plot |
| SenkouSpanB | The Senkou SpanB plot |
| Color |
|---|
Click the color rectangle under the plot's name to open the palette. Use the slider at the bottom to set the opacity of the color.  Palette To create a custom color: Palette To create a custom color:
The custom-created colors are added to your palette. To remove a custom color, drag it out of the palette. |
| Weight |
| Change the value (in px) to adjust the thickness of the plot. |
| Type |
The following plot types are available:
|
OVERLAYING
Check Overlaying to display the indicator on the chart. Otherwise, the indicator is shown in a study pane down below.
Note: To reset the settings, click Restore to Default next to the SETTINGS: INDICATOR'S TITLE
Was this article helpful?