Stochastic RSI
- DarkLight
Stochastic RSI
- DarkLight
Article summary
Did you find this summary helpful?
Thank you for your feedback!

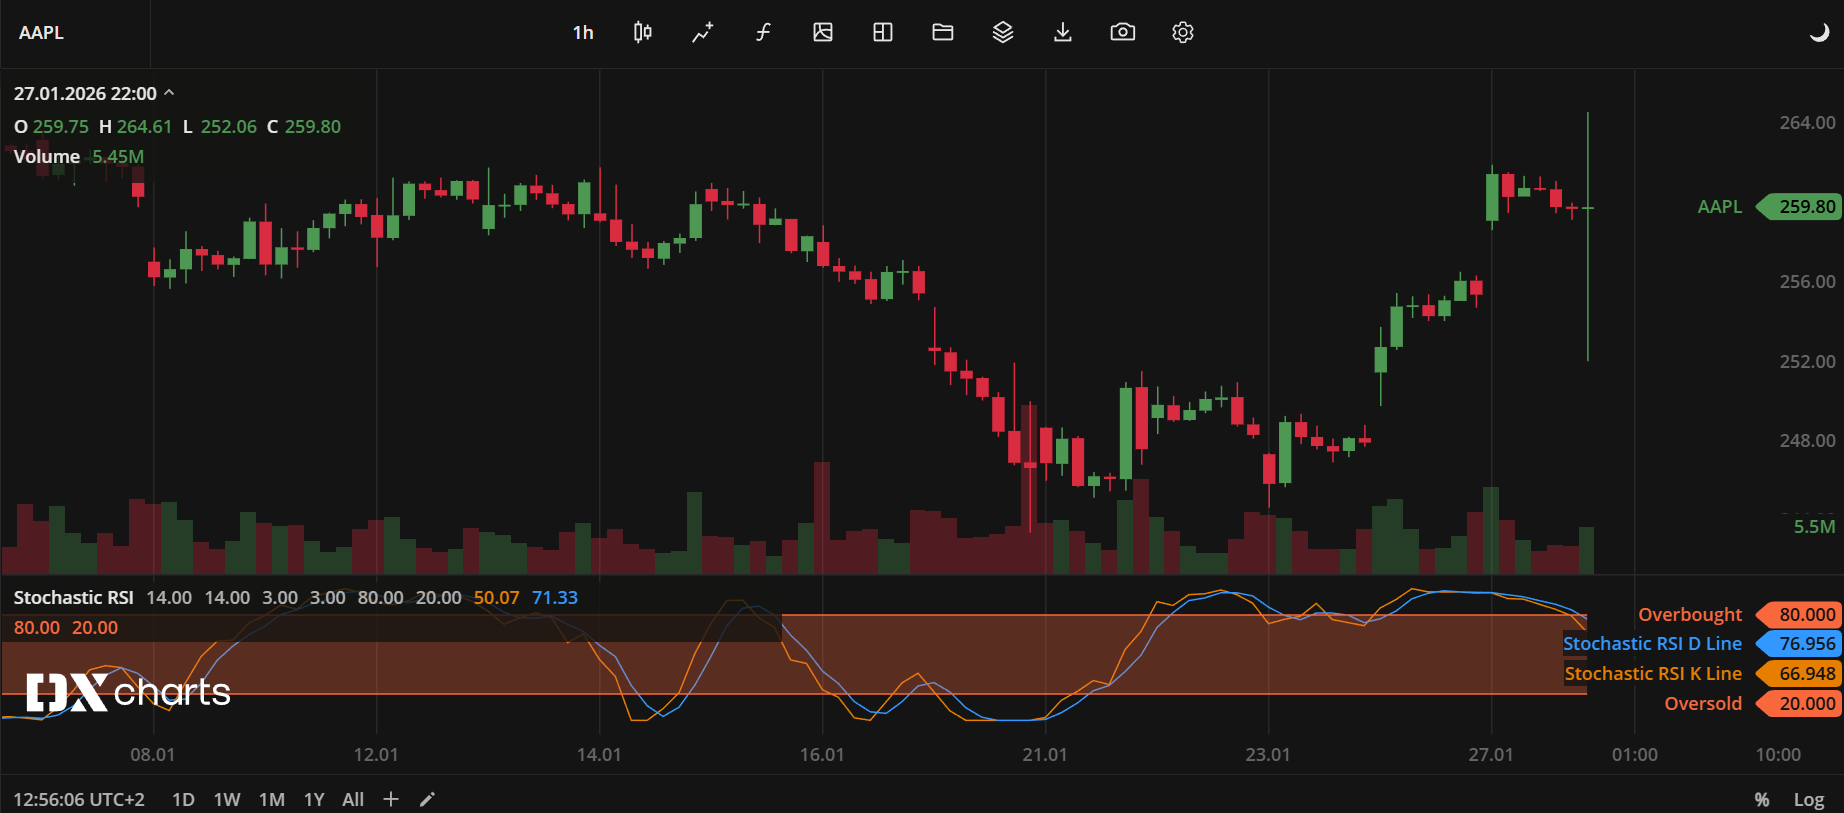
Stochastic Relative Strength Index, Stochastic RSI or StochRSI is a momentum oscillator that applies the stochastic formula to Relative Strength Index (RSI) values instead of price. It enhances sensitivity to short-term moves and ranges from 0 to 1, with values above 0.8 typically marking overbought conditions and below 0.2 marking oversold levels. Often used to anticipate momentum shifts, reversals, and divergences, it appears in a separate panel with two lines: %K (main value) and %D (smoothed signal). This value is calculated by positioning the RSI within its range over a user-defined period, typically 14.
where:
Lowest RSI – the lowest RSI over the selected period
Max RSI – the highest RSI over the selected period
Stochastic RSI
INPUTS
Input | Description |
|---|---|
RSI Length | The number of bars used to calculate RSI |
Stochastic Length | The number of RSI values used to calculate StochRSI |
KPeriod | The smoothing factor for the %K line |
DPeriod | The smoothing factor for the %D signal line |
Overbought | The upper reference level for overbought conditions |
Oversold | The lower reference level for oversold conditions |
Price | Price input used to calculate RSI |
Price |
|---|
The following data sources are available for the price:
|
PLOTS
The plot renders the data you are working with on the chart. You can show/hide a plot by clicking the corresponding item in the settings. Every plot has a set of basic settings that you can change: color, weight, and type.
Plot | Description |
|---|---|
StochasticRSI K Line | The main line showing the StochRSI value |
StochasticRSI D Line | The smoothed signal line based on %K |
Overbought | The overbought level |
Oversold | The oversold level |
Color |
|---|
Click the color rectangle under the plot's name to open the palette. Use the slider at the bottom to set the opacity of the color.  Palette To create a custom color:
The custom-created colors are added to your palette. To remove a custom color, drag it out of the palette. |
Weight |
Change the value (in px) to adjust the thickness of the plot. |
Type |
The following plot types are available:
|
OVERLAYING
Check Overlaying to display the indicator on the chart. Otherwise, the indicator is shown in a study pane down below.
Note: To reset the settings, click Restore to Default next to the SETTINGS: INDICATOR'S TITLE
Was this article helpful?