Time axis
- DarkLight
Time axis
- DarkLight
Article summary
Did you find this summary helpful?
Thank you for your feedback!
(26).webp)
Overview
Time axis is a horizontal scale that is used to evenly distribute candles on a chart according to time when mapping data onto the chart. The start time of the chart is established by the timestamp of the leftmost visible candle. This candle's time is defined by its left edge, and subsequent intervals start with the timestamp of the next candle. 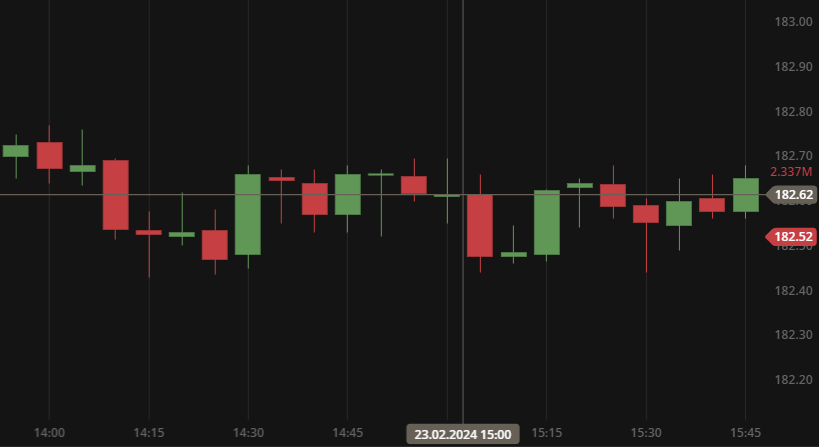 Time axis
Time compression
The candles are consistently spaced, but the time intervals between them may be irregular. When a candle is missing, the time it represents will be compressed, as the previous candle will encompass its time. For example, in an 8-hour chart with extended session data, a standard candle represents 8 hours divided into eight evenly spaced intervals. If an interval returns no data, both 8-hour intervals are merged into a single candle resulting in a compression of time. In some cases, the final candle for Friday may encompass 56 hours of data (including 8 hours from Friday's trading session and 48 hours for the entire weekend), if there is no data available for Saturday and Sunday.
Extended hours
The time axis can display the extended session hours – trading hours that occur before or after the regular trading day of a stock exchange. Extended hours can only be activated for aggregation periods less than 1d and for instruments that support trading when the major markets are closed. The extended-hours trading session relies on the chart time axis to highlight the extended session intervals.
.png) The extended session zones are highlighted on the chart
The extended session zones are highlighted on the chart
To activate Extended hours, on the Toolbar, go to the Chart settings ![]() >Data > Extended hours.
>Data > Extended hours.
Session breaks
Session breaks on the time axis can help you easily distinguish where one trading periods ends and another begins. These breaks are indicated by vertical dotted lines and can be displayed on intraday charts (tick, minute, hour).
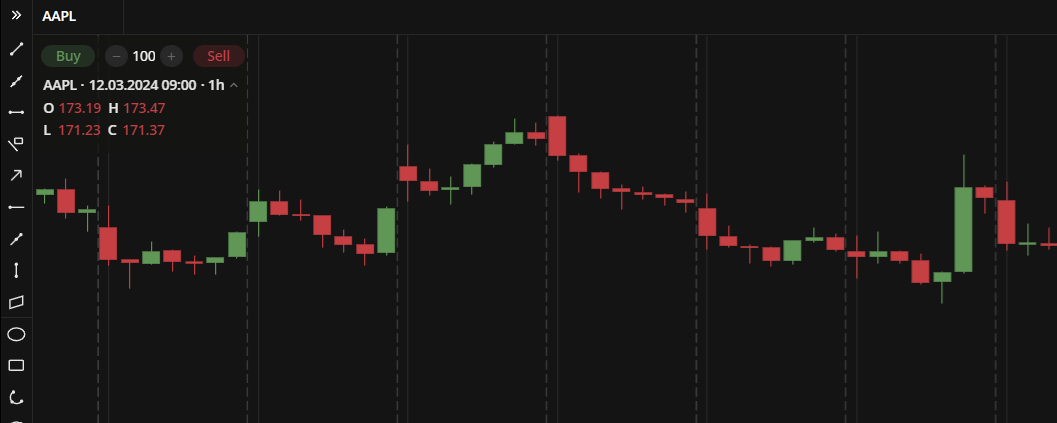 The session breaks are shown by vertical dotted lines To activate Session breaks, on the Toolbar, go to the Chart settings
![]() >Data > Session breaks.
>Data > Session breaks.
Market state/Timezone
By default, DXcharts uses the timezone of the exchange where the financial instrument is traded. You can check the working hours of the exchange and the opening time for the selected instrument by checking the current market state. To do this, hover over the icon.png) on the toolbar.
on the toolbar.
.png) Market state
Market stateYou can also set a different timezone in UTC format. Click the current timezone in the lower left corner of the chart area to see a list of all available timezones.
Was this article helpful?