Trend
- DarkLight
Trend
- DarkLight
Article summary
Did you find this summary helpful?
Thank you for your feedback!
(24).webp)
The Trend chart is similar to the Candle chart but with different coloring patterns. The candles are colored depending on the Open and the Close price values of the current aggregation period and two adjacent aggregation periods.
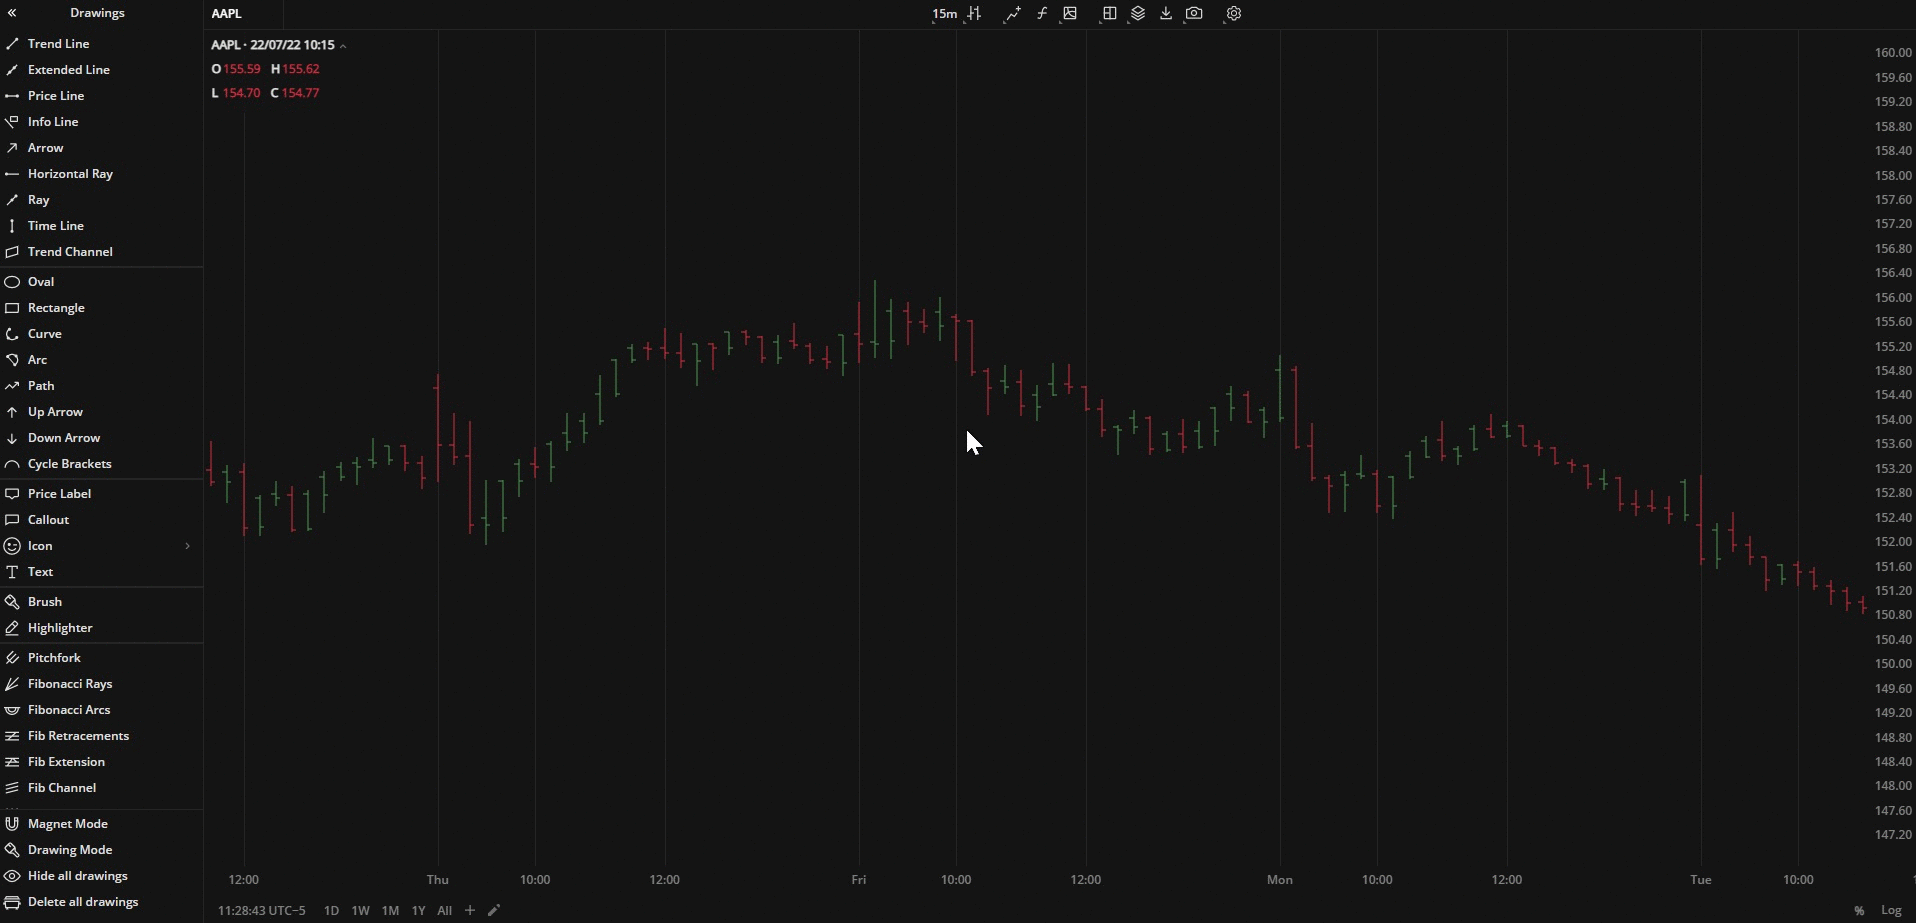 Trend chart
Coloring
The borders of the Trend chart candle are colored depending on whether the current Close price is greater or lower than the previous Close price. The candle body is then color-filled depending on whether the Close price is greater or lower than the Open price of the current aggregation period. The coloring patterns are:
Border
- Current Close > Previous Close - Bull border (green by default)
- Current Close < Previous Close - Bear border (red by default)
- Current Close = Current Open (or for the first candle on the chart) - Doji (white by default)
Body filling
Bull border candle:
- Close price > Open price - Bull (green by default)
- Close price < Open price - Bear (red by default)
Bear border candle:
- Close price < Open price - Bear (red by default)
Doji border candle:
- Close price < Open price - Doji (white by default)
In all other cases, the candle body is left hollow.
You can select alternative colors for candle body and borders in Settings![]() > Colors
> Colors![]() .
.
Was this article helpful?