- DarkLight
Version 3.5.0
- DarkLight
Release date: Apr 26, 2021
Corporate events on chart
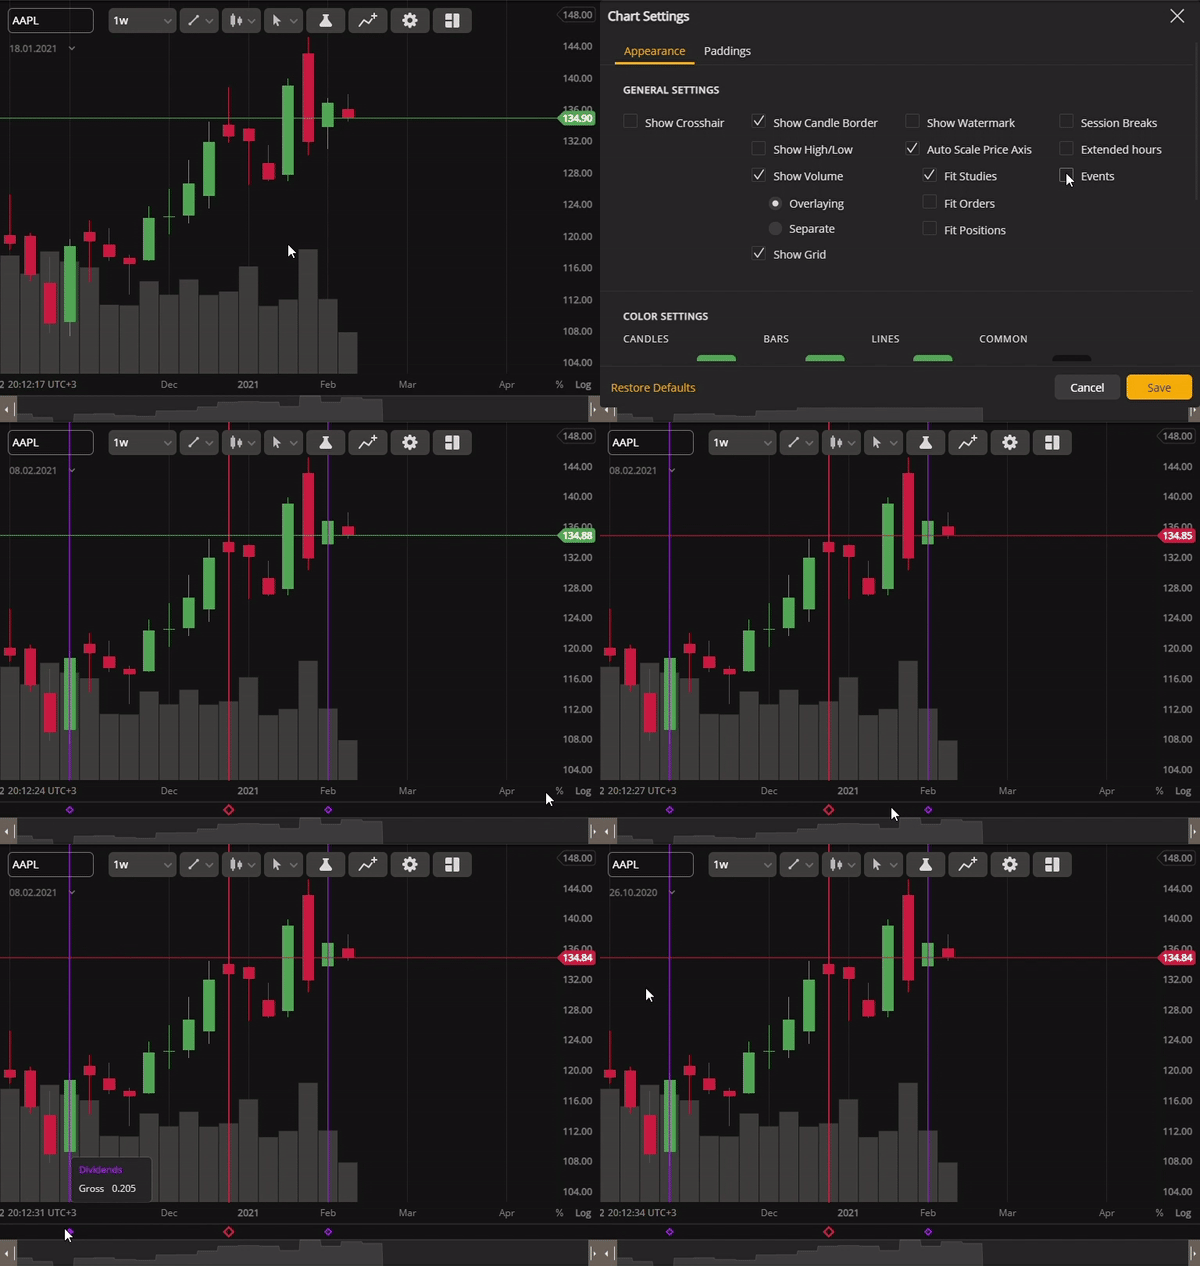
We've added the ability to display important financial events such as earnings, dividends, and splits on the chart. To enable the Events on chart, go to Settings and select Events. The markers with additional information about the event will appear on the time axis below the chart.
 View corporate events on chart and track their effect
Price scale improvements
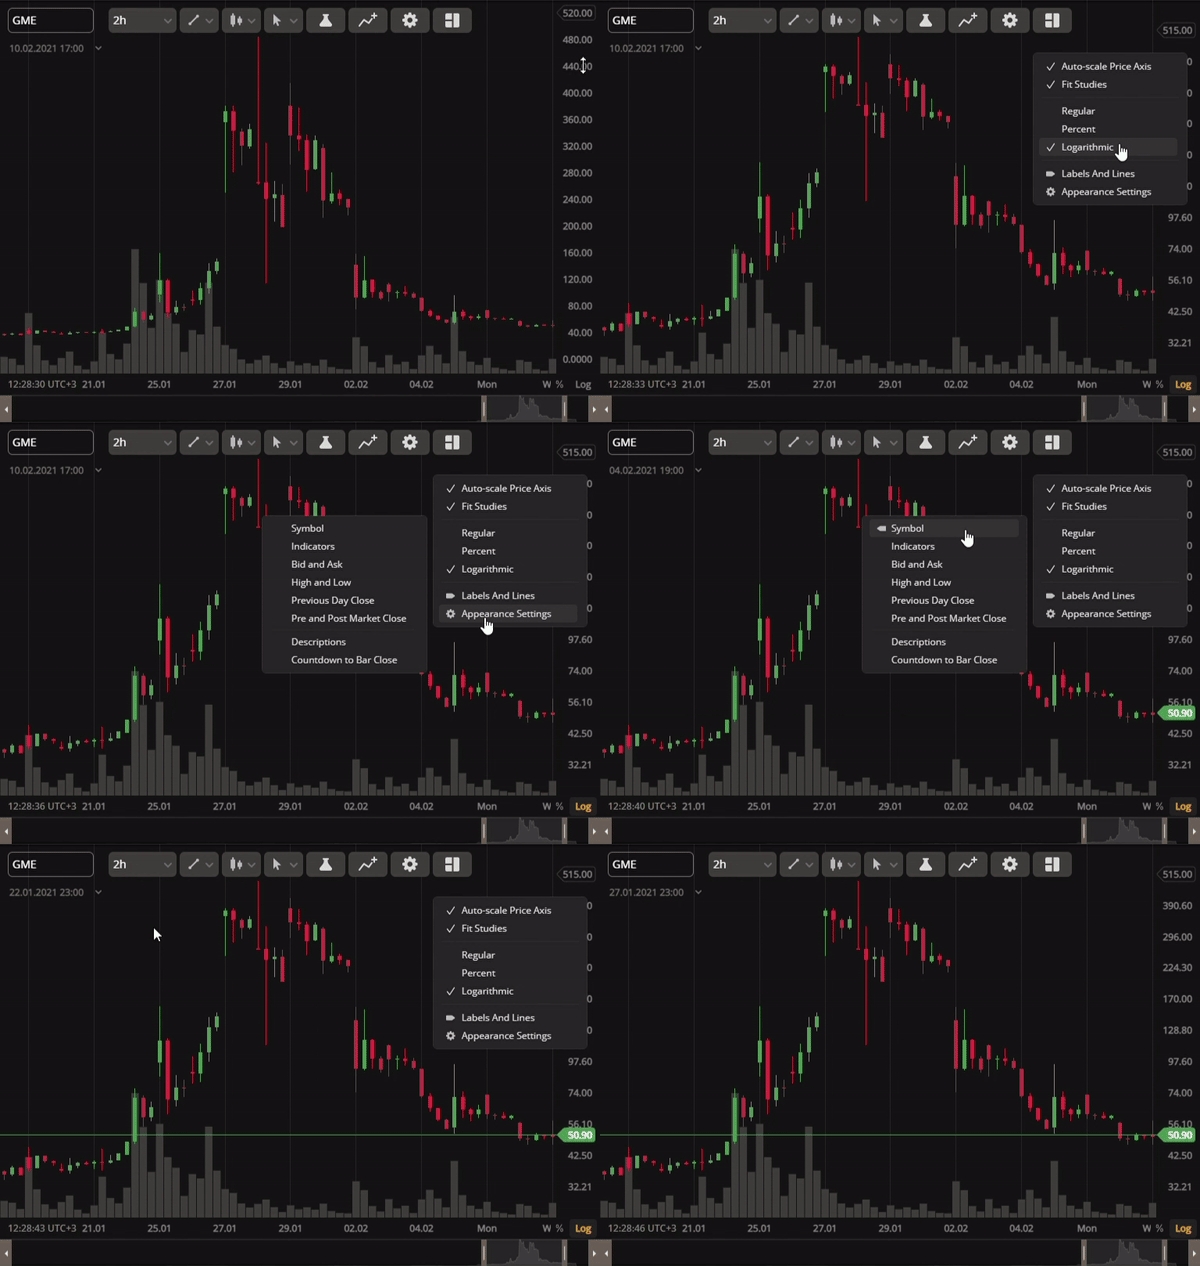
Our price scale has been updated with more information and is now easier to use. You can display labels and lines on your chart or switch to a logarithmic scale by right-clicking on the price axis.
 Switch to a logarithmic price scale and display labels
Custom aggregation period
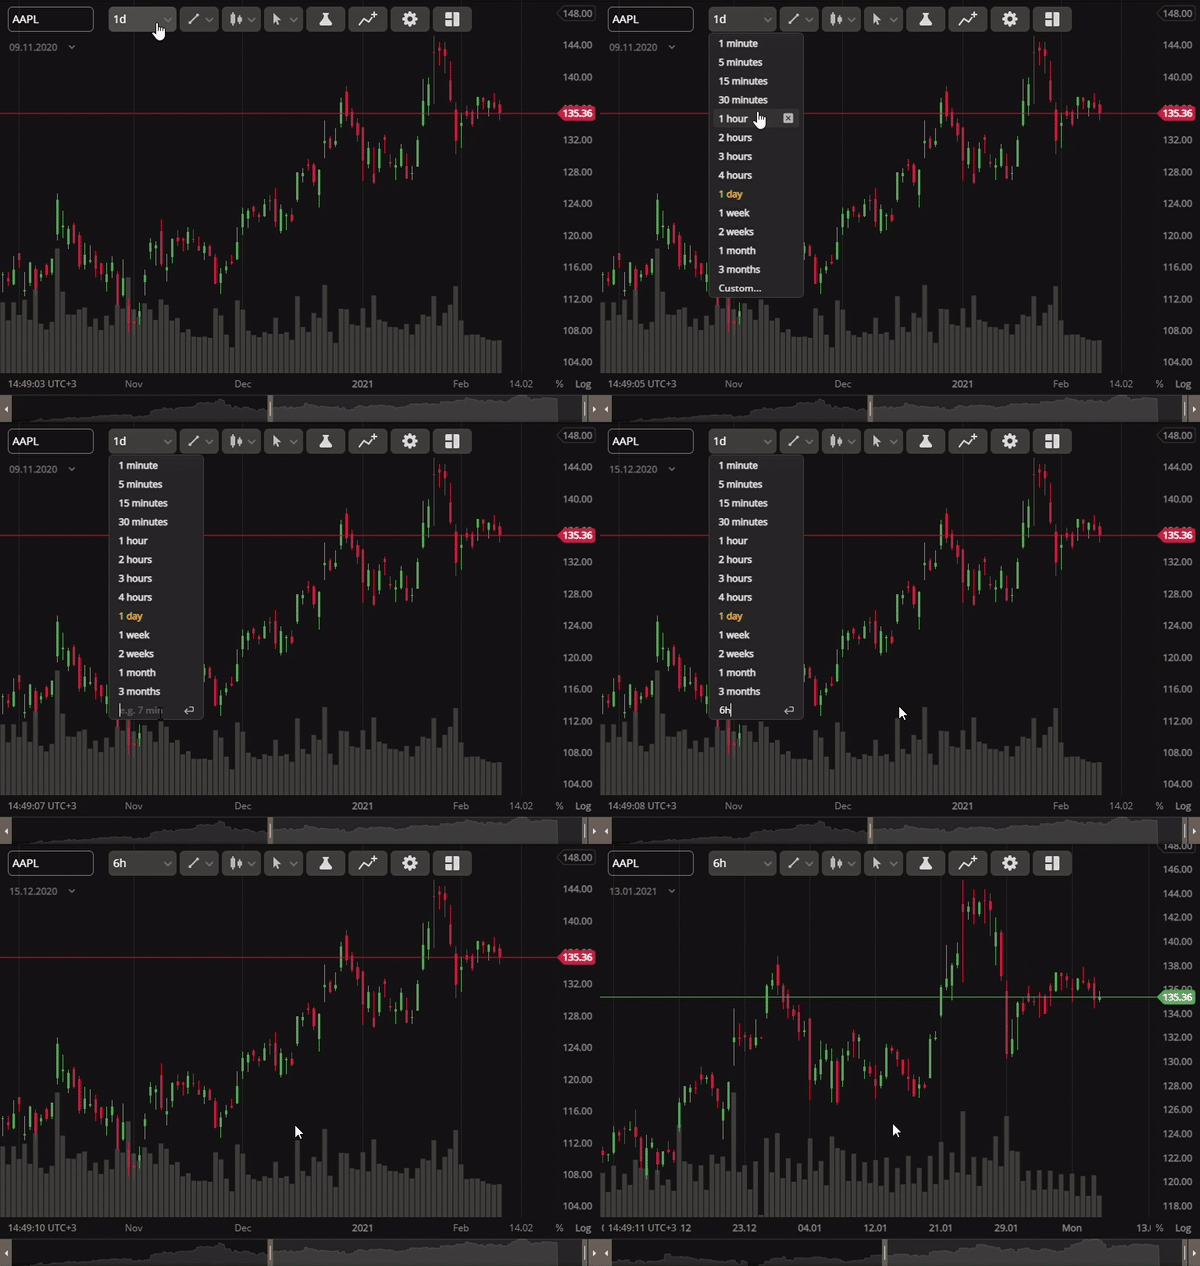
Previously, you could only choose from a set of candle aggregation periods on the chart. Now, you have the option to enter your own custom aggregation period. To do so, click on the arrow next to the aggregation period, select Custom, and type in your desired aggregation period (e.g. 6m). The chart will then display the candles (bars) aggregated for this period. You can also remove any aggregation period from the list including the default ones.
 Add any aggregation period of your choosing to the chart

