- DarkLight
Version 4.1.0
- DarkLight
Release date: Nov 2, 2021
DXscript
The new addition to our charting package enhances its analytical capabilities. DXscript is a domain-specific language for series processing. It's designed to transform one data series into another and is intended for use by individuals without prior programming experience. As a result, studies written in DXscript tend to be concise and comprehensive. Now, you can add as many studies (indicators) as you want with the parameters you want.
.png) Adding a custom indicator
Adding a custom indicatorFour new chart types
We have added four new chart types to provide users with more versatile charts and additional technical analysis capabilities. These time-based charts are essential for technically-minded users to save time and focus on more complex tasks.
| A scatterplot is a chart that shows prices as dots scattered across the chart, with no connecting lines. When zooming in, close prices are shown. This chart type is useful for identifying correlations between two or more data points, as well as outliers or data gaps. For details, see Scatterplot. | Hollow Candles plot the difference between the close and open of the current bar, as well as nearby candles. For details, see Hollow Candles. |
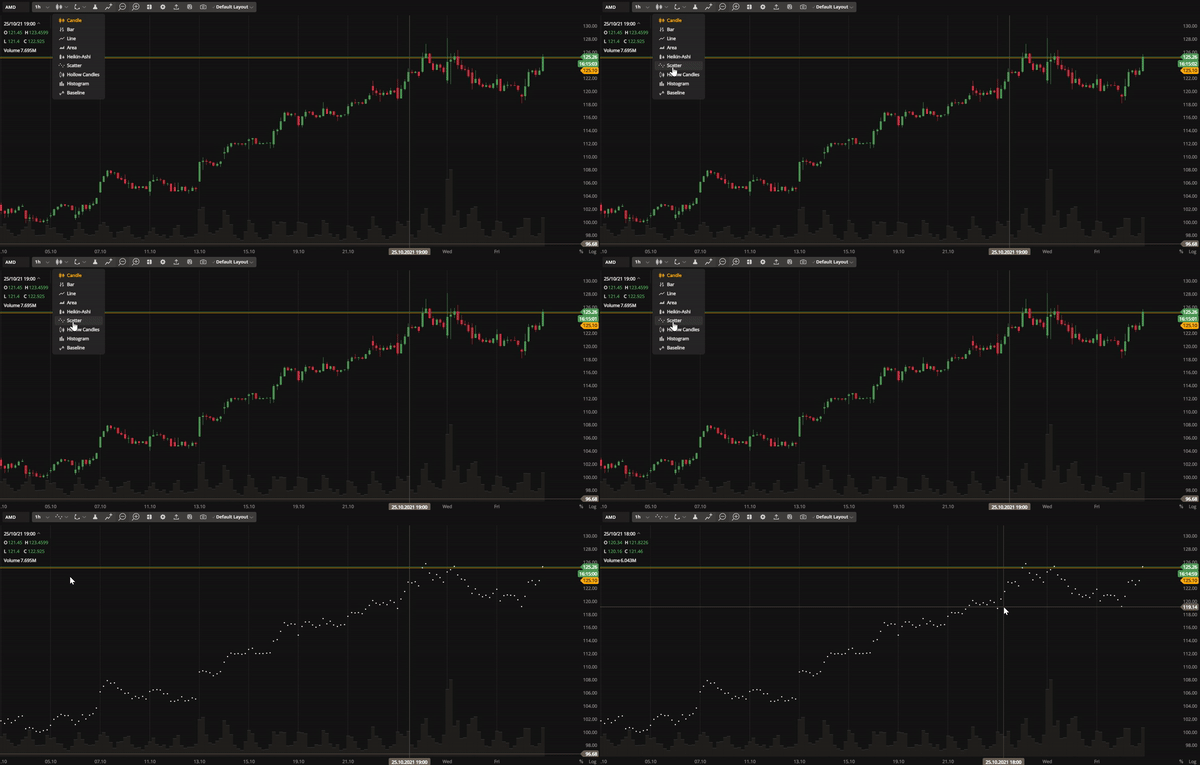 Scatterplot Scatterplot | 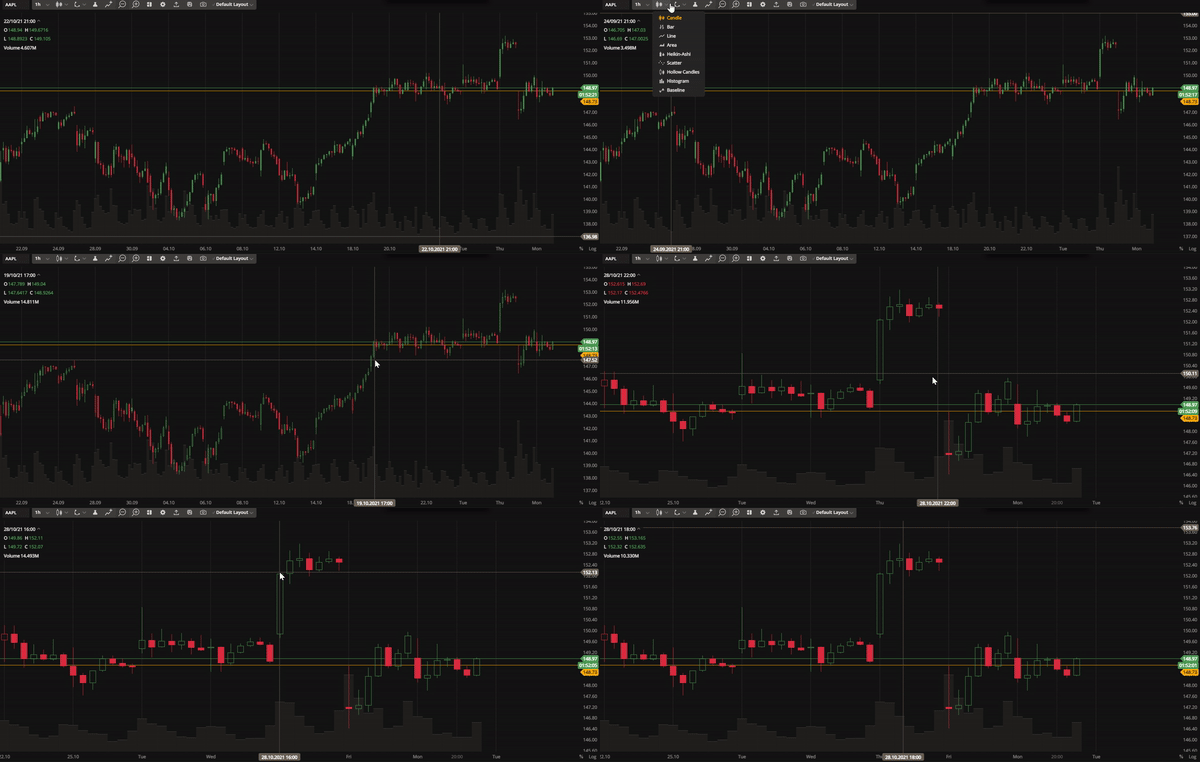 Hollow Candles Hollow Candles |
| Histograms are useful for displaying the distribution of variables. They allow traders to identify peaks, outliers, and patterns such as skewness or symmetry. For details, see Histogram. | The Baseline chart shows price movements in relation to a trader-selected baseline, which can be helpful in analyzing price fluctuations. For details, see Baseline. |
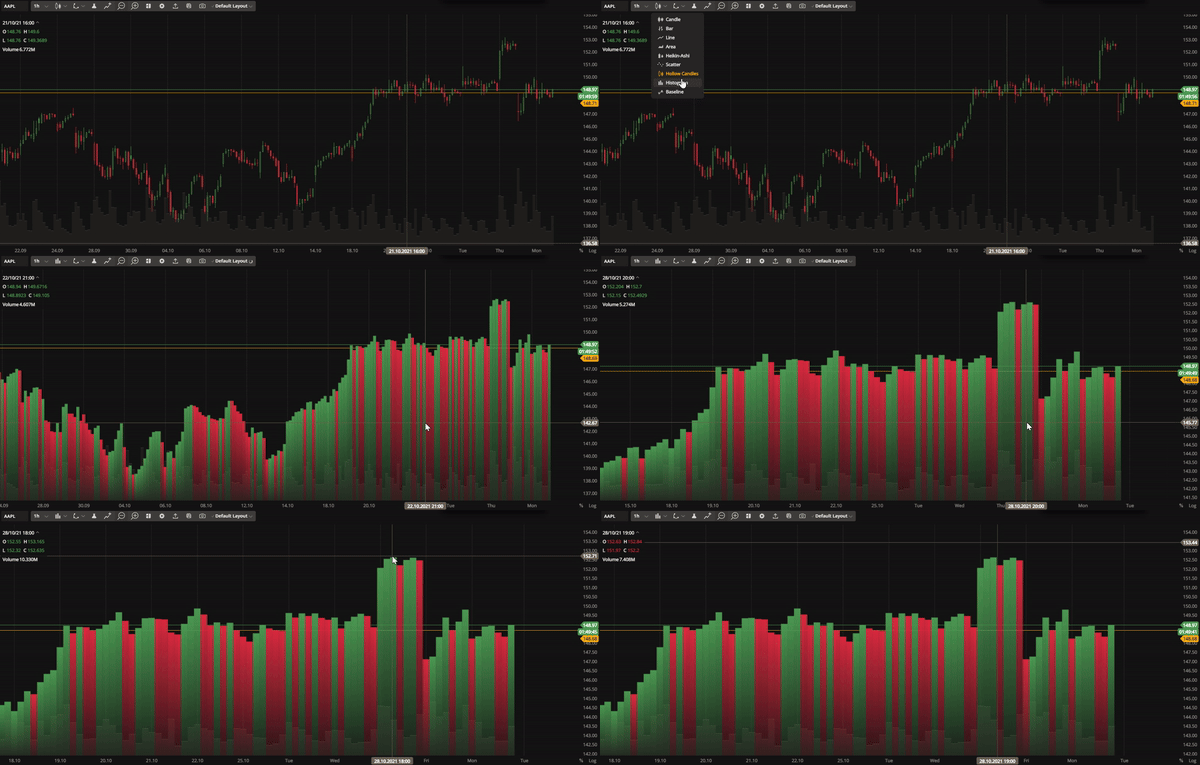 Histogram Histogram | 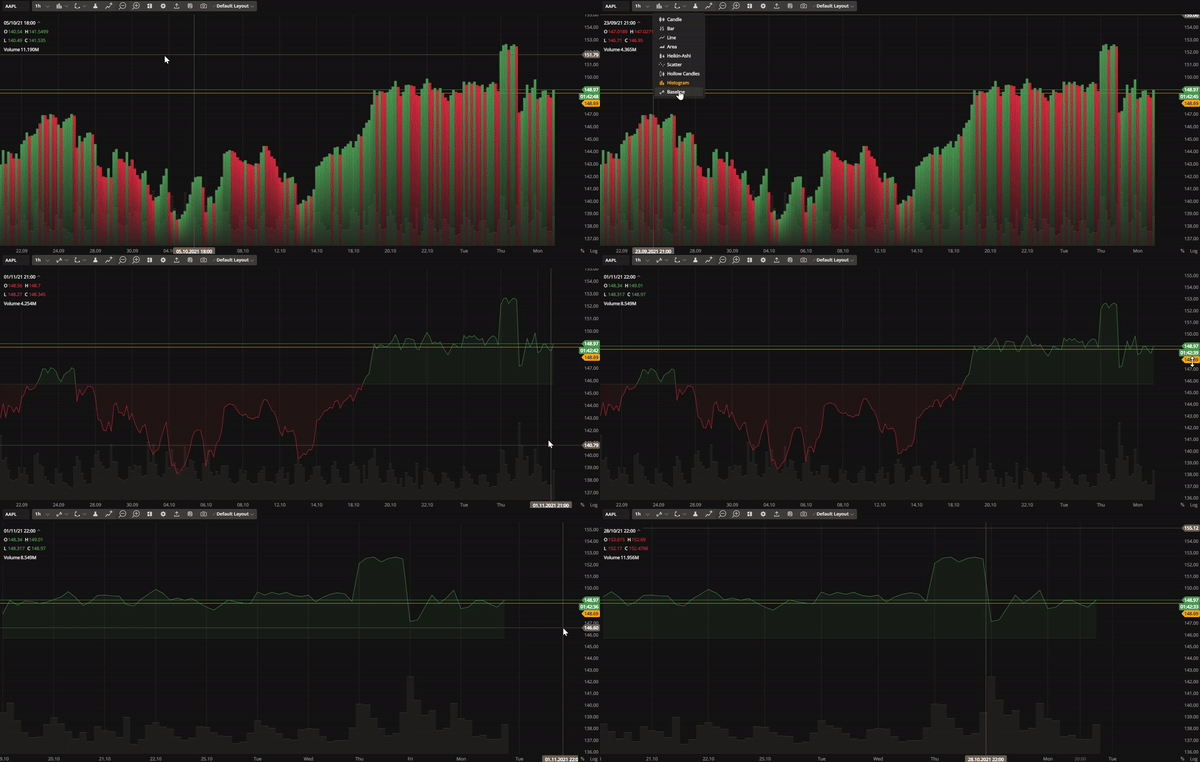 Baseline Baseline |
Trade from the chart
You can now buy or sell instruments directly from the chart using our mini order entry feature. This allows you to place Market, Limit, Stop Loss, or Take Profit orders without losing sight of the chart. The system will automatically group your orders if they are close to each other. In addition, you will always know how your future order will affect you because the PL is calculated automatically. To enable the Trade from the chart, select Orders and Positions in the Settings. A plus sign will then appear on the price axis.
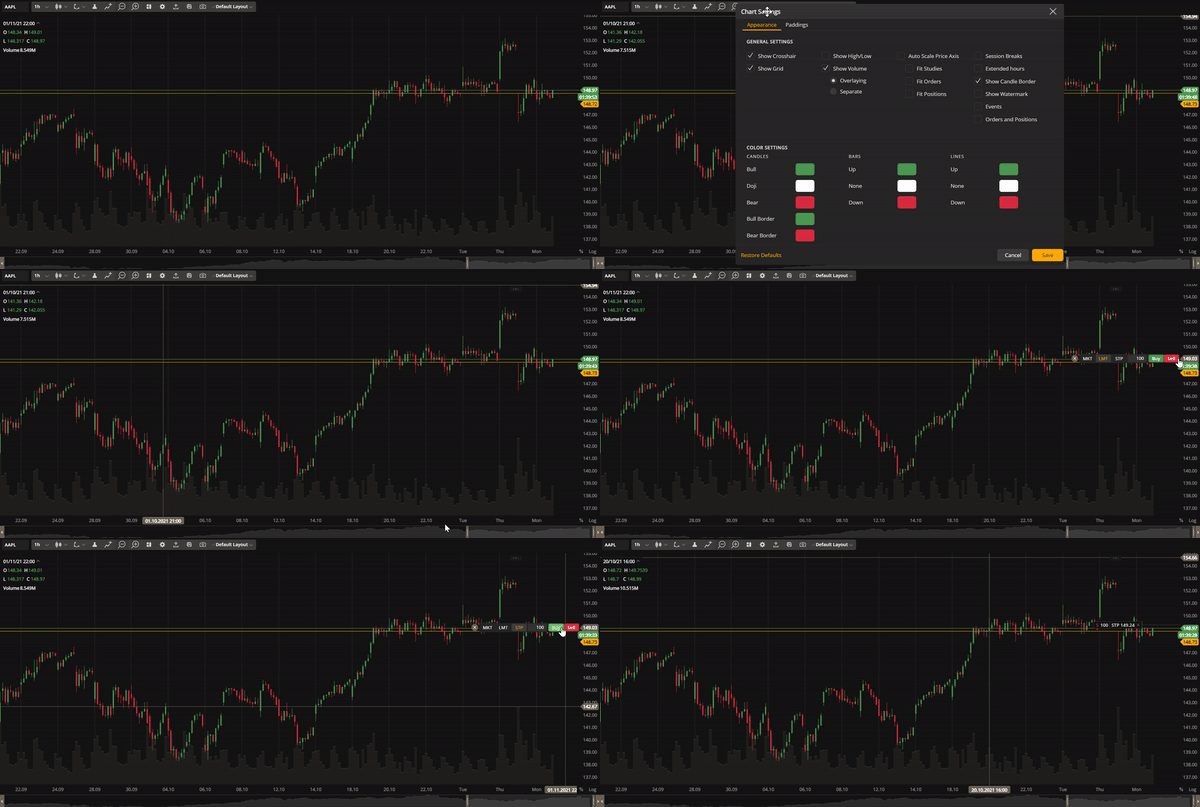 Issue multiple order types from the chart
Toolbar improvements
To save space and simplify the user interface in the multichart mode, we have replaced an individual toolbar for each chart with a single toolbar that controls them all at once. Simply click on the chart you want to control to select it. You can also customize the order of the buttons within the toolbar as needed.
.gif) Use a single toolbar to control multiple charts
Use a single toolbar to control multiple chartsEven more drawings
New drawings have been added. These include Arc and Fibonacci Arcs, Fibonacci Retracements, Fibonacci Channel and Fibonacci Timezones; Gann Fan, Gann Box, Gann Square; Elliot Impulse Wave, and Elliot Correction Wave.
The drawings allow technical analysis and market trend tracking. See the full list of drawings here.
