- DarkLight
Version 4.8.0
- DarkLight
Release date: Jun 27, 2022
WaveTrend indicators
We have added two more predefined studies (indicators) for you to use: WaveTrend and its advanced version - WaveTrend with crosses. These oscillators are often used by both day traders and swing traders. WaveTrend is an oscillator based on market wave theory that helps identify overbought and oversold areas. The version with crosses has dots that signal buy and sell opportunities.
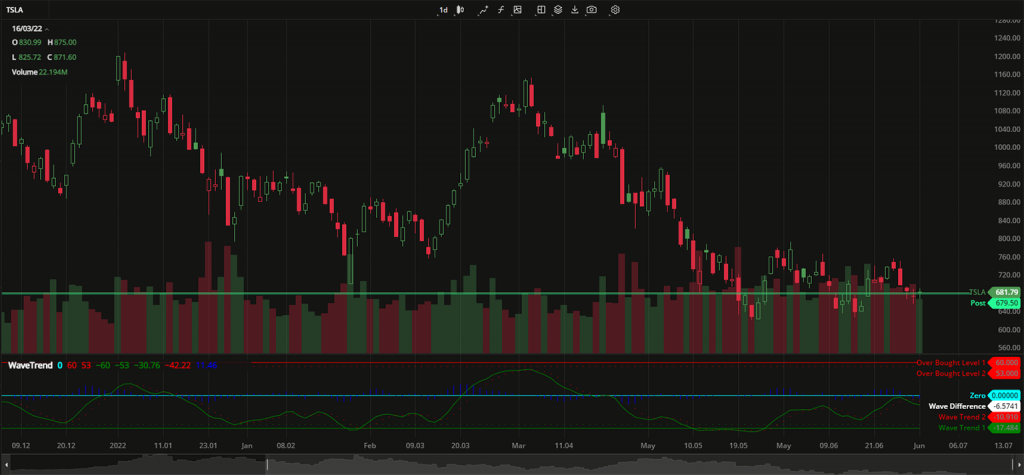 WaveTrend
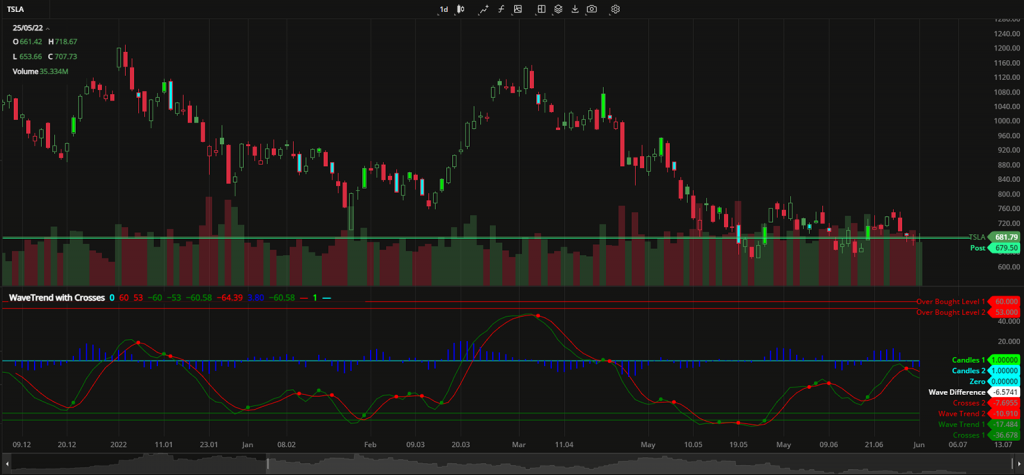 WaveTrend with crosses
Regression Trend drawing
Regression Trend is a channel-like drawing based on a trendline. It has upper and lower deviation levels plotted at the same distance from the trendline. The main idea of this drawing is to identify where the price exceeds these deviation levels.
.gif) Regression Trend drawing
Regression Trend drawing
Tick aggregation
The chart now has the option to display every tick price change through 1 tick aggregation. Custom aggregation periods can also be created with any desired number of ticks, such as a 2 tick chart or 5 tick chart, and so on.
Chart settings: Align stamps to session start
This setting synchronizes the candles on the chart with the market opening time. Once the first data appears, you'll see the volume bars.
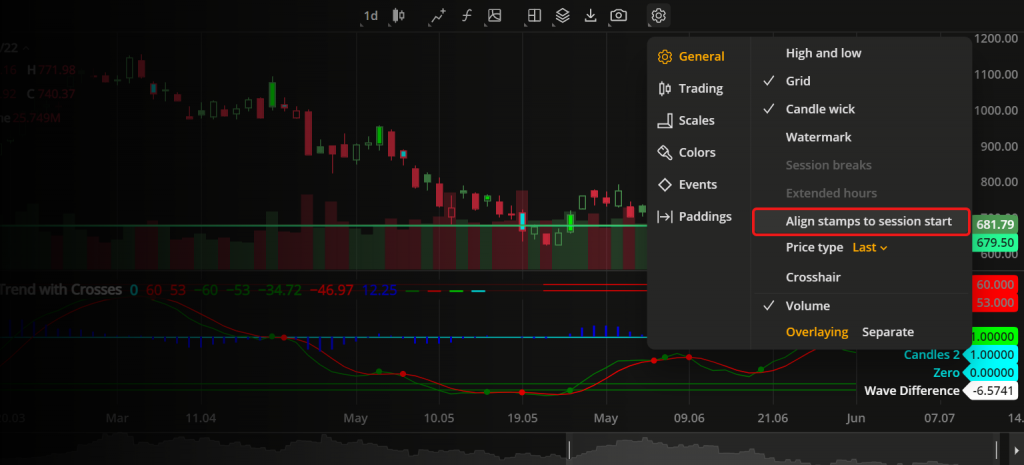 Align candles with sessions
Chart settings: Additional price type
Last price type is now available. Select it to display the candles showing the latest market prices for your instrument on the chart. The full list of price types to build the chart with is now the following:
- Last. The most recent price at which deals were made in the market.
- Market. The current available price in the market.
- Bid. The highest price offered for buying available in the market.
- Ask. The lowest price offered for selling available in the market.
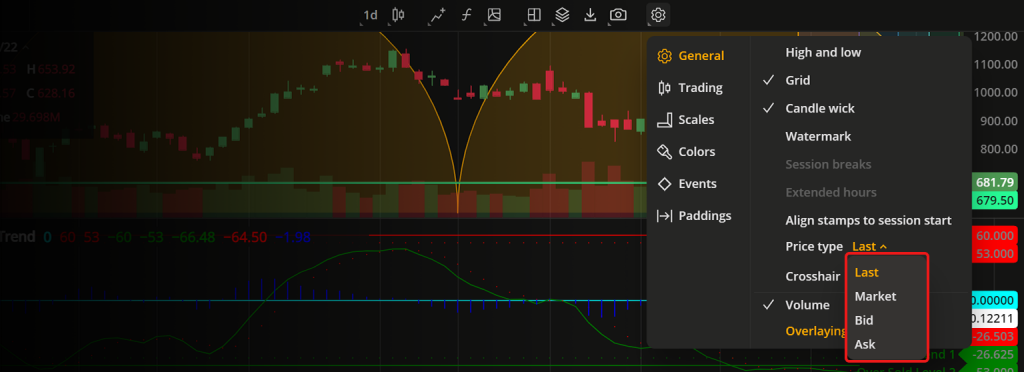 Price type settings
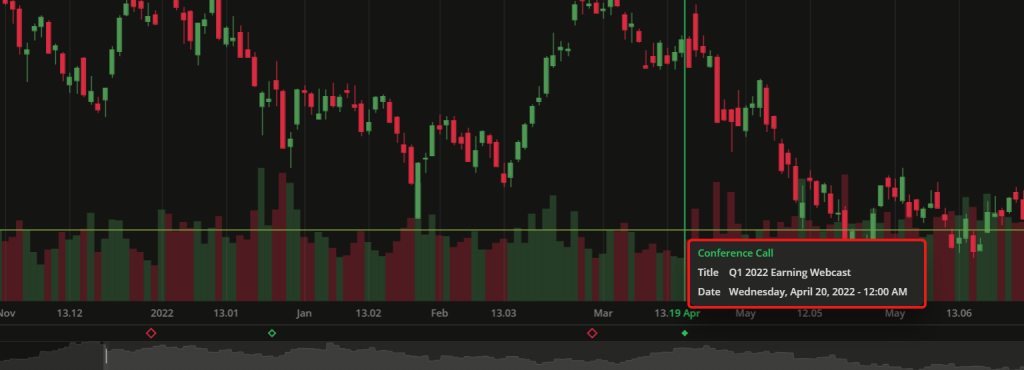
Conference Call event
Events are a useful way to ensure you don't miss a regular call during the trading session. We have added a new type of an event - Conference Call. You can activate it in the Chart Settings to see notification signs of such events at the bottom of the chart.
