- DarkLight
Version 5.10.0
- DarkLight
Release date: Apr 23, 2024
Easy way to put your logo on your charts
We've simplified the process of adding a logo to your charts.
 Custom logo is now displayed on charts Magnet mode on a Multichart layout
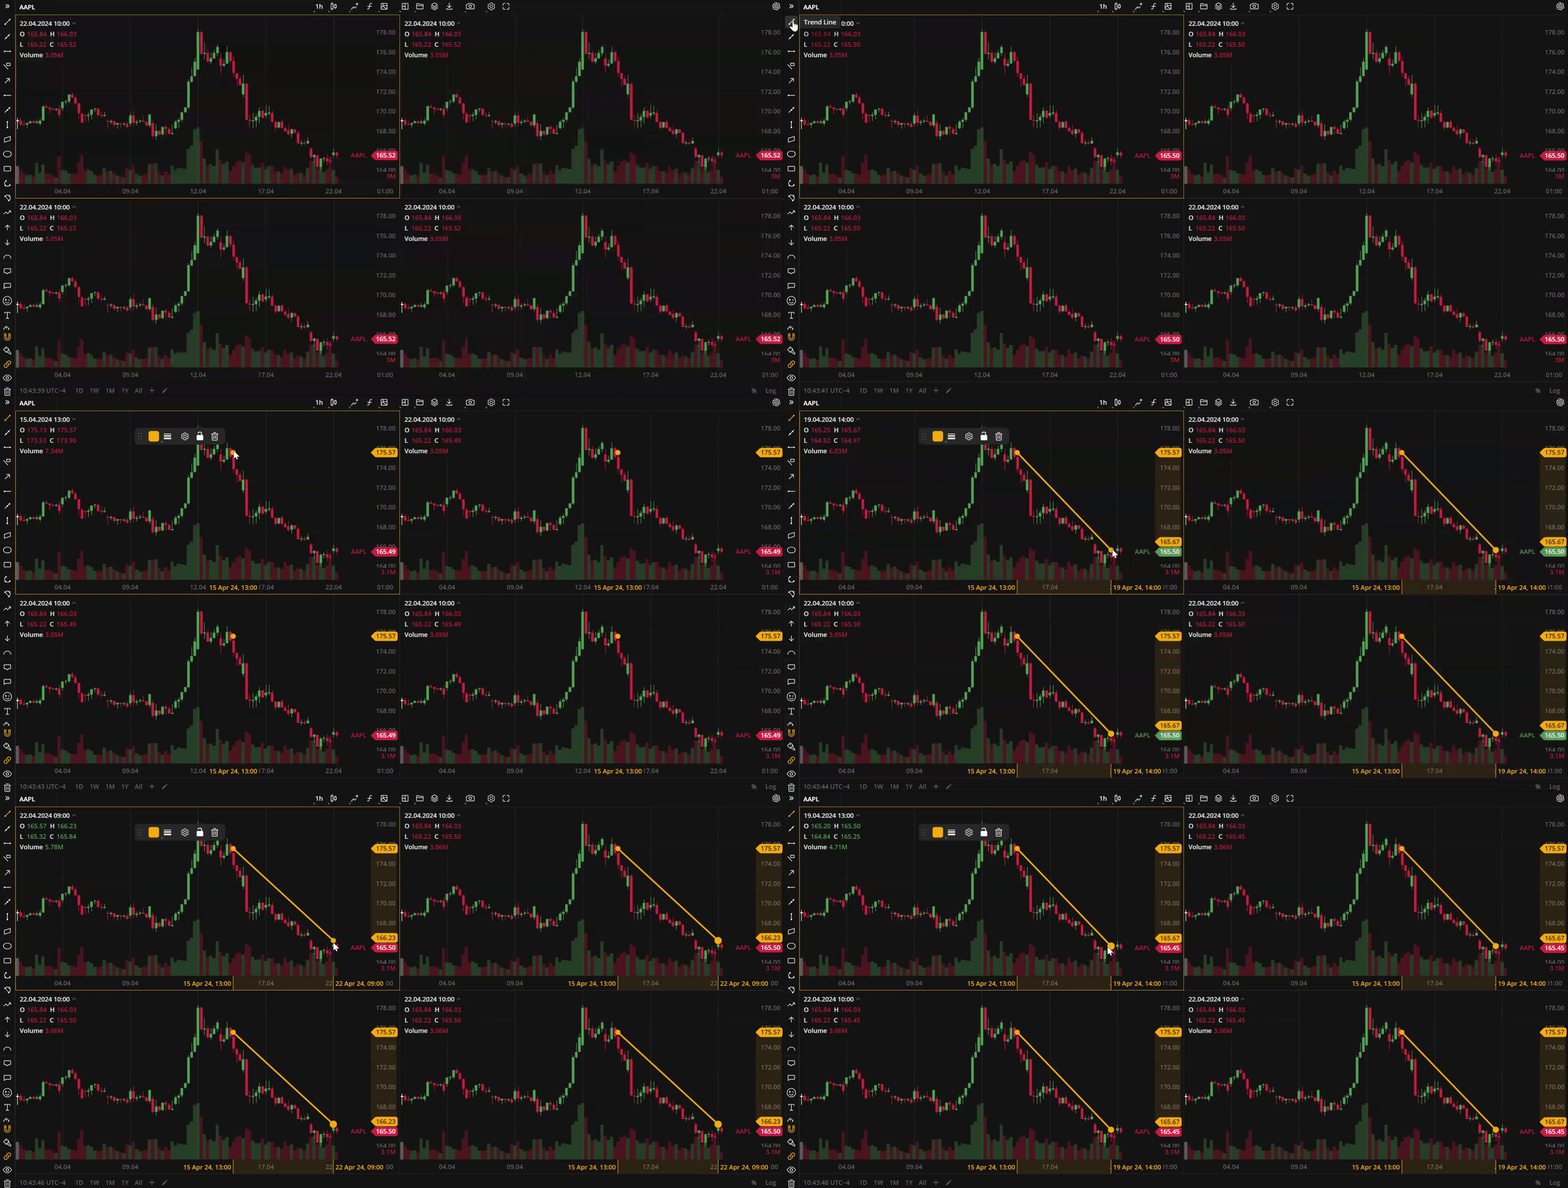
Magnet mode, a feature that turns on/off the ability to snap drawings to the candle elements, now also works on a Multichart layout.
 Magnet mode in a multichart layout
New 8-charts layout for Multichart
We've added an additional layout for the Multichart menu. Now, the working area can hold up to 8 different charts without losing the overall performance and stability.
Trading hours and market state for selected instrument
We've added the possibility to view the current market state (open/closed), the exchange working hours, and the time until the exchange opens for the selected instrument. Hover over.png) to see the details on the exchange work for the current instrument.
to see the details on the exchange work for the current instrument.
.png)
The chart shows the loading state during the accumulation of trade data
We've added a loader/load state to the widget and charting library, now the screen flickers when the trade data is still accumulating and loading.
.gif) Loading the trade data
Loading the trade data
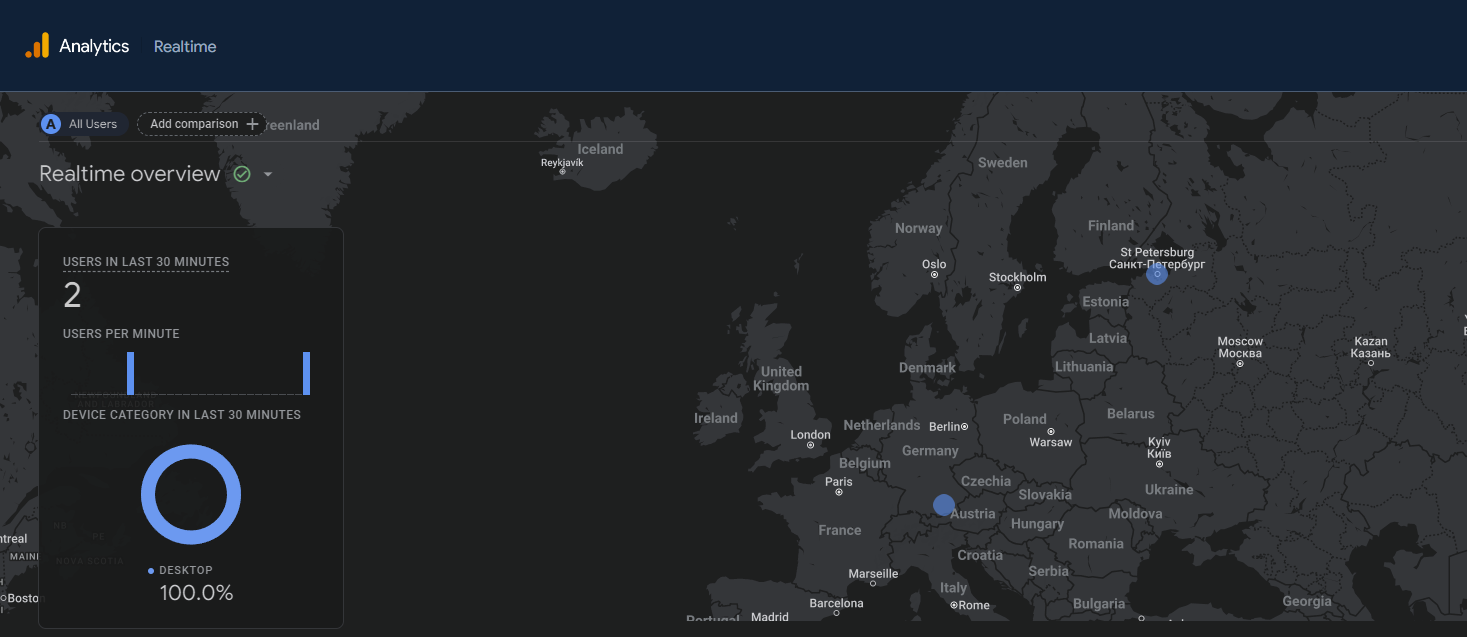
Google Analytics for the library and widget
Now, you can use Google Analytics for your purposes in the charting library and the widget.
 GA in DXcharts
Bug fixes and improvements
- Added API method to configure placing of OCO orders from the Order menu.
- Chart icon scale is now saved correctly in the layout.
- Fixed an issue where multiple charts were sometimes displayed offset from each other.
- Corrected export data accuracy for volume on charts.
- Fixed incorrect order of column names when exporting chart data.
- Fixed an issue with dragging a baseline in the Baseline chart type for Edge browser.
- Removed an insecure call used to calculate formatters for time to improve content security policies in Electron.
- Fixed an issue where switching themes in the advanced widget did not work properly.
- Fixed widget issues specific to Safari browser.
- Adjusted the maximum zoom out to prevent the chart diagram from scrolling off-screen.
- Fixed an issue where changes made in dxScript were not dispalyed in GUI.
- Updated incorrect package.json version published with releases.
- Improved effects for default timeframe presets and aggregation behavior on mobile phones.
- Updated the text for the trial watermark to improve clarity.
- Fixed "Download chart image" error for smoother operation.
- Y-axis configuration in the advanced widget now works properly.
- Added the possibility to hide the main chart area on mobile phones.
- Y-axis bounds are now properly set after chart initialization with visible === false.
Indicators and drawings
- Fixed an issue where undo/redo did not work properly when synchronizing drawings across multiple charts.
- Fixed crashes in charts after adding a drawing and activating multichart mode.
- Fixed incorrect icon for Fibonacci Circles drawing.
- Fixed ability to create empty Text/Callout drawings.
- Fixed an issue with ignoring labels in the price scale settings for new indicators.
- Fixed an issue when drawings with highlighted labels don't show seconds.
- "Reset to Default" button now works correctly when changing some drawing settings.
- Fixed an issue where the opacity of the indicator did not change.
- Fixed dispaly issues with TD Sequential indicator.
- Fixed an issue with length parameters of Linear Regression Channel indicator.
- Fixed incorrect calculation of bounds for indicators.
- Fixed incorrect icon used for removing indicators.
Miscellanious
- Released documentation v 1.0.2 for Android library.
- Successfully integrated with Vite.


.png)