- DarkLight
Version 5.0.0
- DarkLight
Release date: Dec 21 2022
Equivolume chart type
A new chart type, Equivolume, has been added. It is similar to a Candle chart but with some key differences. First, the equivolume bars represent the price ranges of an asset (high/low) prices and do not show the open price. However, the close price can be displayed if needed. To turn it on, go to the Settings > General > Show close price.
The second diffirence is the adjustable width of the bars, which corresponds proportionally to the volume traded during the aggregation period. For details see Equivolume.
.png) The plotted equivolume bars are of different widths
The plotted equivolume bars are of different widths
Price-based aggregation period - Range
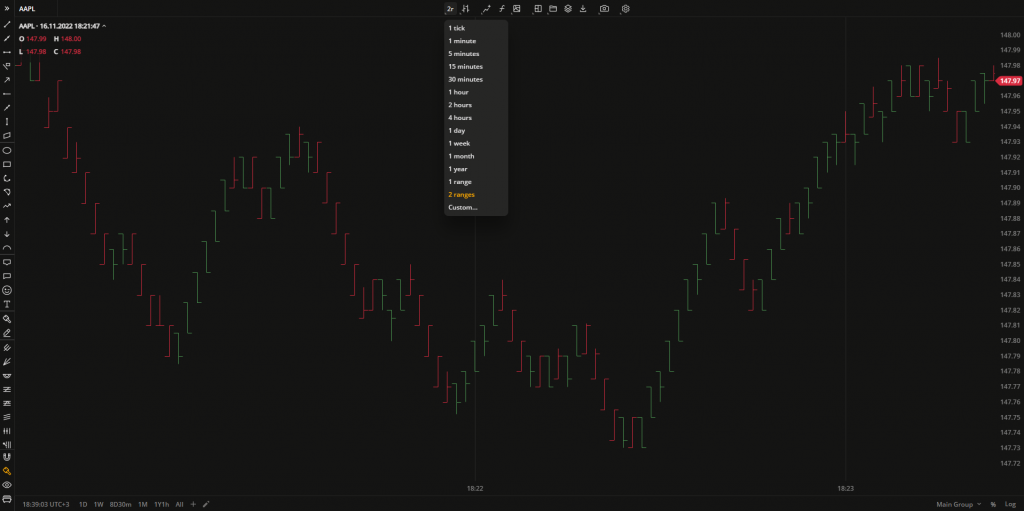
The latest update includes a new feature called Range aggregation. Whil time charts use time-based aggregation periods to plot bars, such as 5 seconds, 1 minute, 2 hours, or 1 day, range charts consider only price movements instead of time unitns. This means that the number of bars on the chart will depend on the volatility of the chosen security. The price-based chart should display each bar with a high/low range that matches the specified range.
You can use the range aggregation only in the Bar chart type. Additionally, custom aggregation allows you to specify the number of ranges: 2 ranges, 7 ranges, or "as-many-as-you-want" ranges.
 The Bar chart with the aggregation period set to 2 ranges
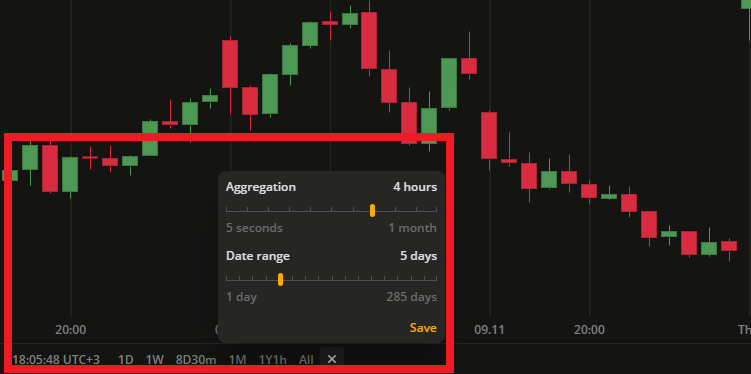
Custom aggregation periods
In this release, we have added a flexible tool for creating aggregation presets. This tool allows you to adjust the aggregation period (the time period of 1 bar), specify a date range, and save these as a preset. The preset will then be displayed on the quick access panel at the bottom-left corner of the charts and can be accessed with just one click.


