DXcharts Tools: Multichart and Compare Charts Features

See all our DXcharts guides here.
Welcome to the next installment in our series of guides to DXcharts – the definitive financial charting library designed for stocks, forex, and crypto enthusiasts.
Last time, we looked at the Trading from chart functionality. Today, we will focus on the importance of the Multichart and Compare charts features. These features are crucial for customizing your workspace and adding the analytical component to your trading activity.
Let’s dive in and discover the flexibility that DXcharts offers in terms of using multiple layouts.
Chart layouts
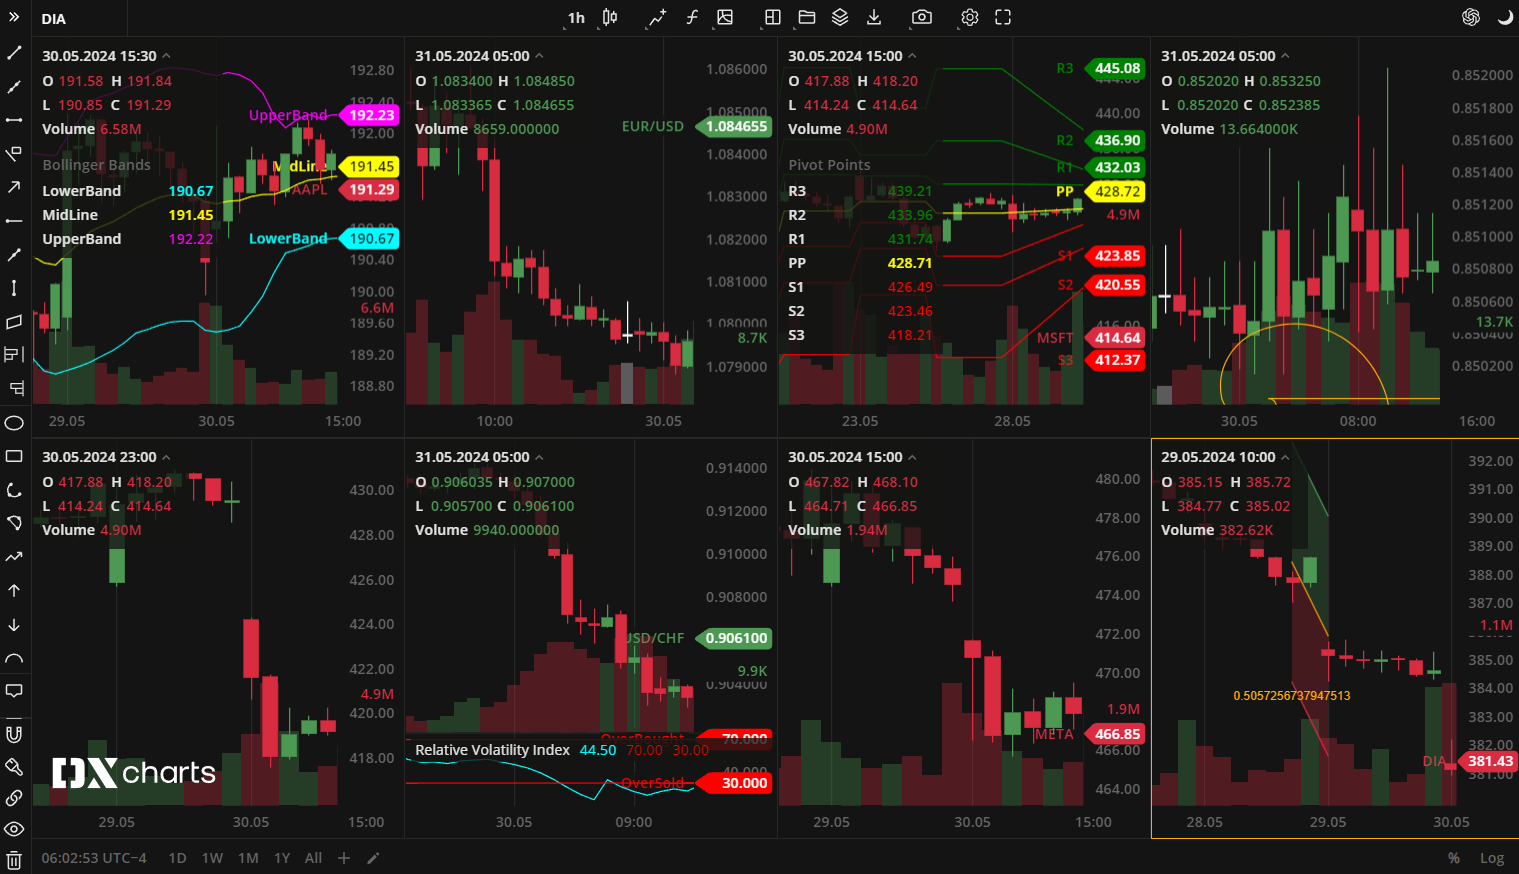
Multichart is a tool designed to separate a chart area into several segments on a single screen. Each segment can be used to tailor and visualize data for specific instruments, aggregation periods, and chart types. You can configure the chart’s appearance, its color, and settings enabling a unique style for each of the charts.
Choose a chart layout from the Toolbar > Multichart menu. Currently, there are 7 chart layouts to choose from:
- Single chart (default)
- 4-charts layout
- Horizontal 2-charts layout
- Vertical 2-charts layout
- Horizontal 3-charts layout
- Vertical 3-charts layout
- 8-chart layout.
To switch between the single view of the selected chart and multichart views, click the Maximize/Minimize icon on the Toolbar.
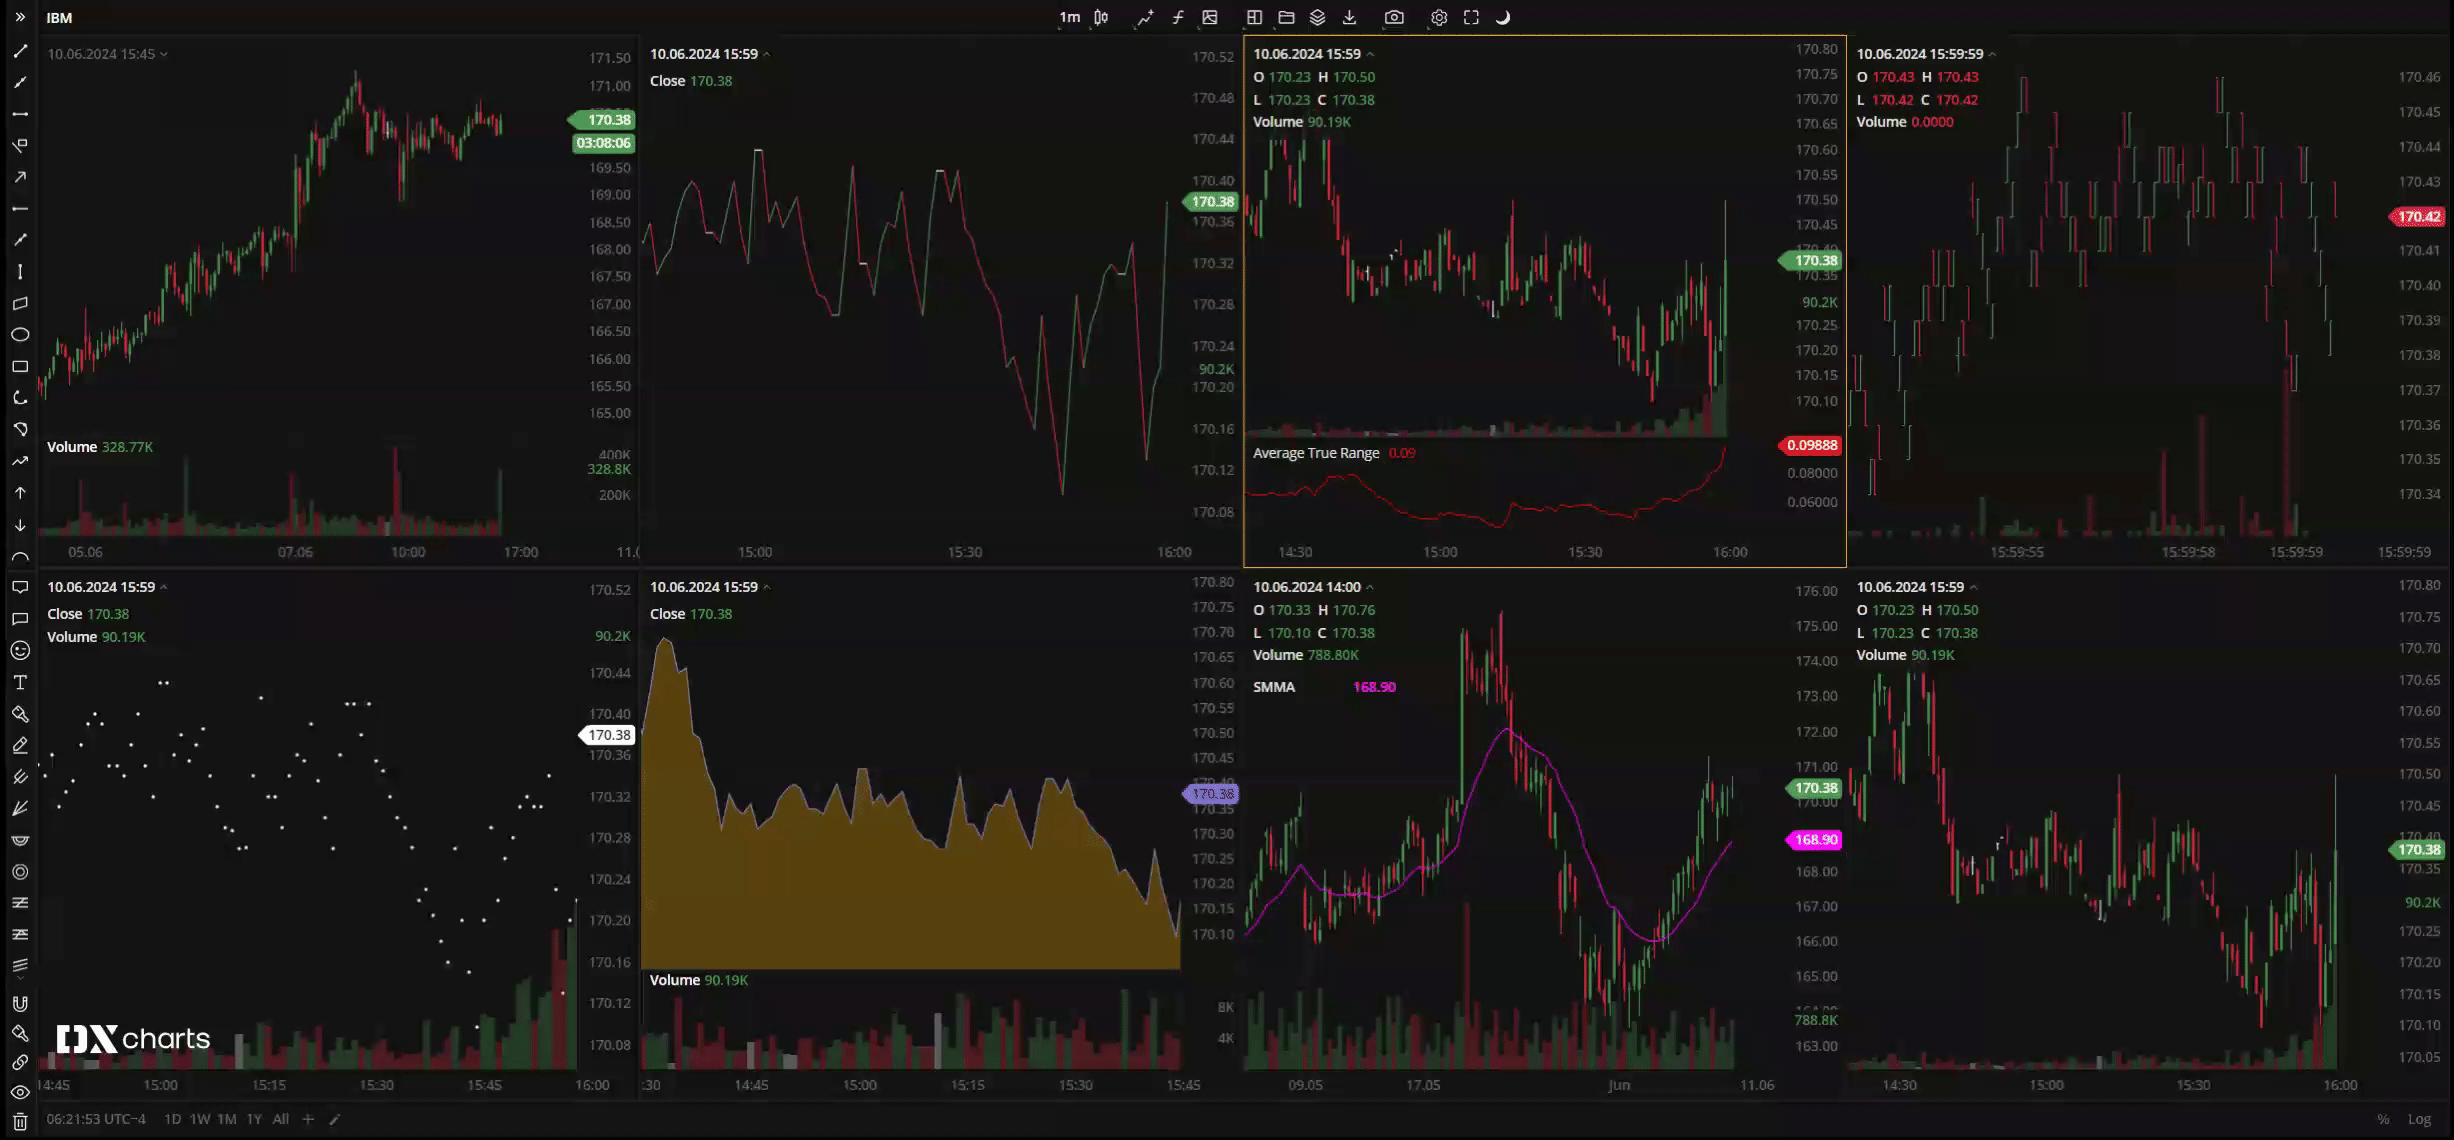
Synchronize menu
Changes made to a selected chart can be synchronized with the other charts, so you can customize all the charts at the same time: apply aggregation periods, change the appearance, add indicators, etc. To do this, select the items to be synchronized in the Synchronize menu.
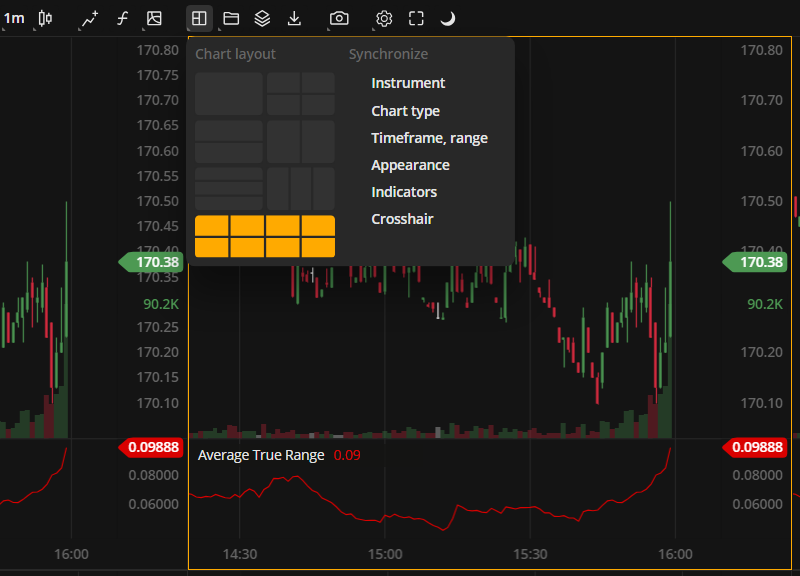
The following chart elements can be synchronized across all charts:
- Instrument. The instrument of the currently selected chart is applied to all charts.
- Chart type. The chart type of the currently selected chart is applied to all charts.
- Timeframe, range. The aggregation period or range of the currently selected chart is applied to all charts.
- Appearance. The colors, grid, legend, and other chart elements of the currently selected chart are applied to all charts. The appearance can be customized in Chart settings > Colors.
- Indicators. The indicators of the selected chart are applied to all charts.
- Crosshair. The crosshair is synchronized on all charts. The crosshair can be enabled in Chart settings > General > Crosshair.
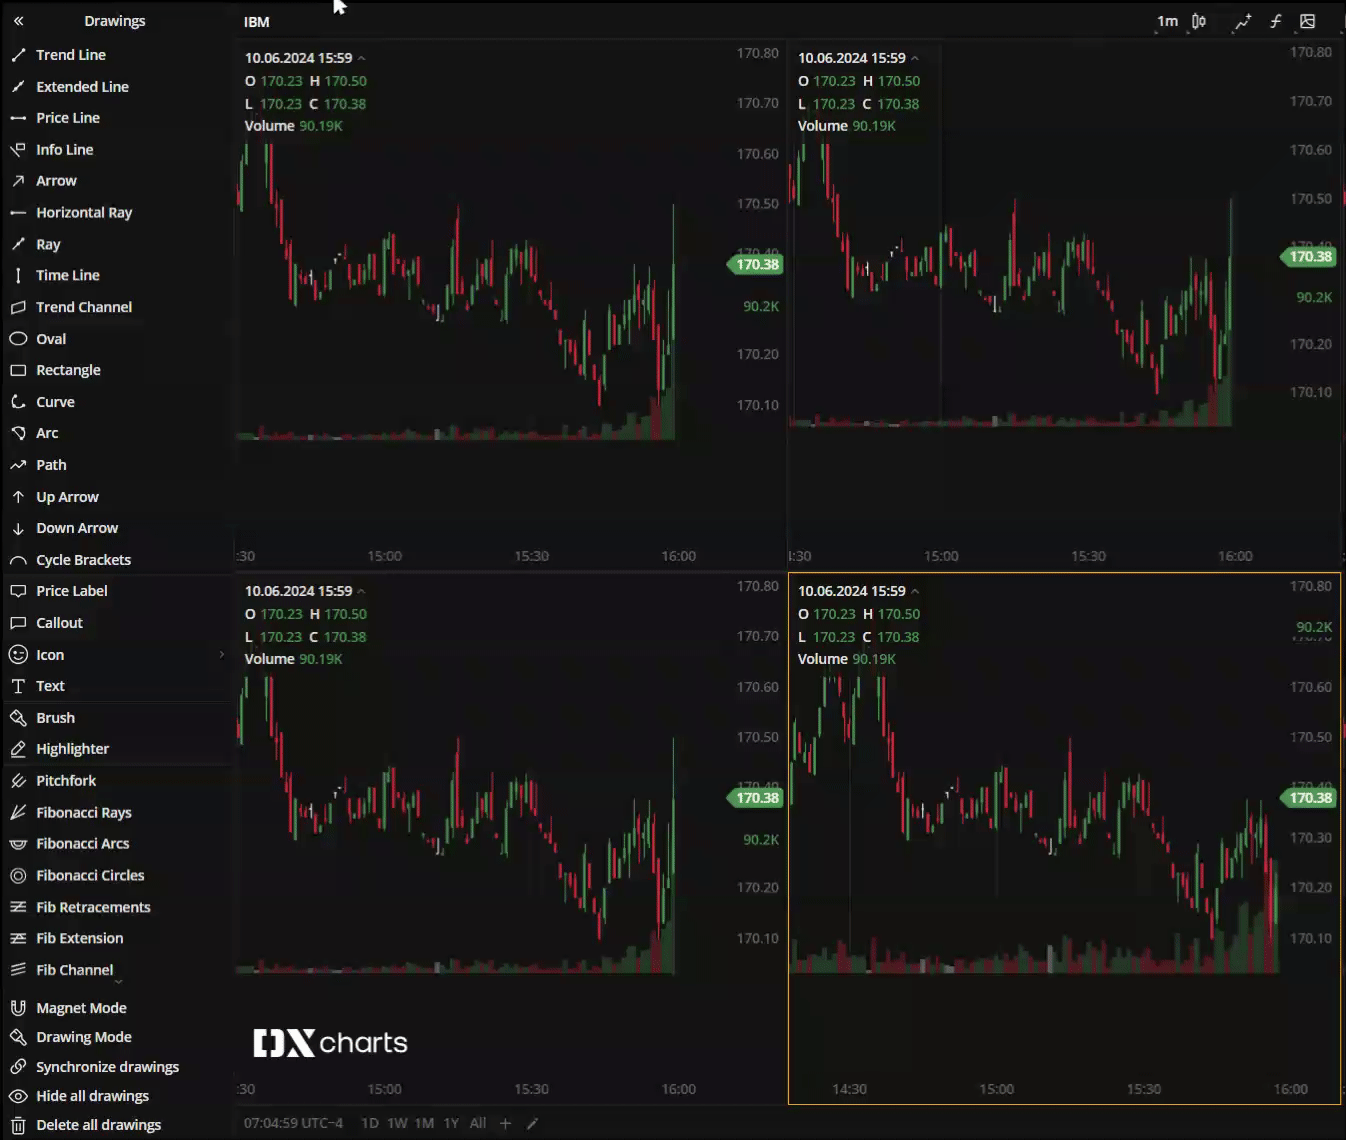
Beyond that, you can also use drawings in a synchronized mode. To enable the ability to draw on all the charts simultaneously in a multichart layout, select Synchronize drawings at the bottom of the Drawings panel on the left.
Compare charts
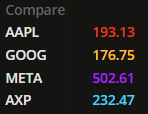
For more flexibility in data analysis, DXcharts has a Compare charts feature. This is an analysis tool that helps to reveal the percentage correlation between multiple instruments displayed on the chart.
Find Compare charts on the Toolbar, type in any symbol, and click to add it to the chart. You can add up to 4 symbols to compare.
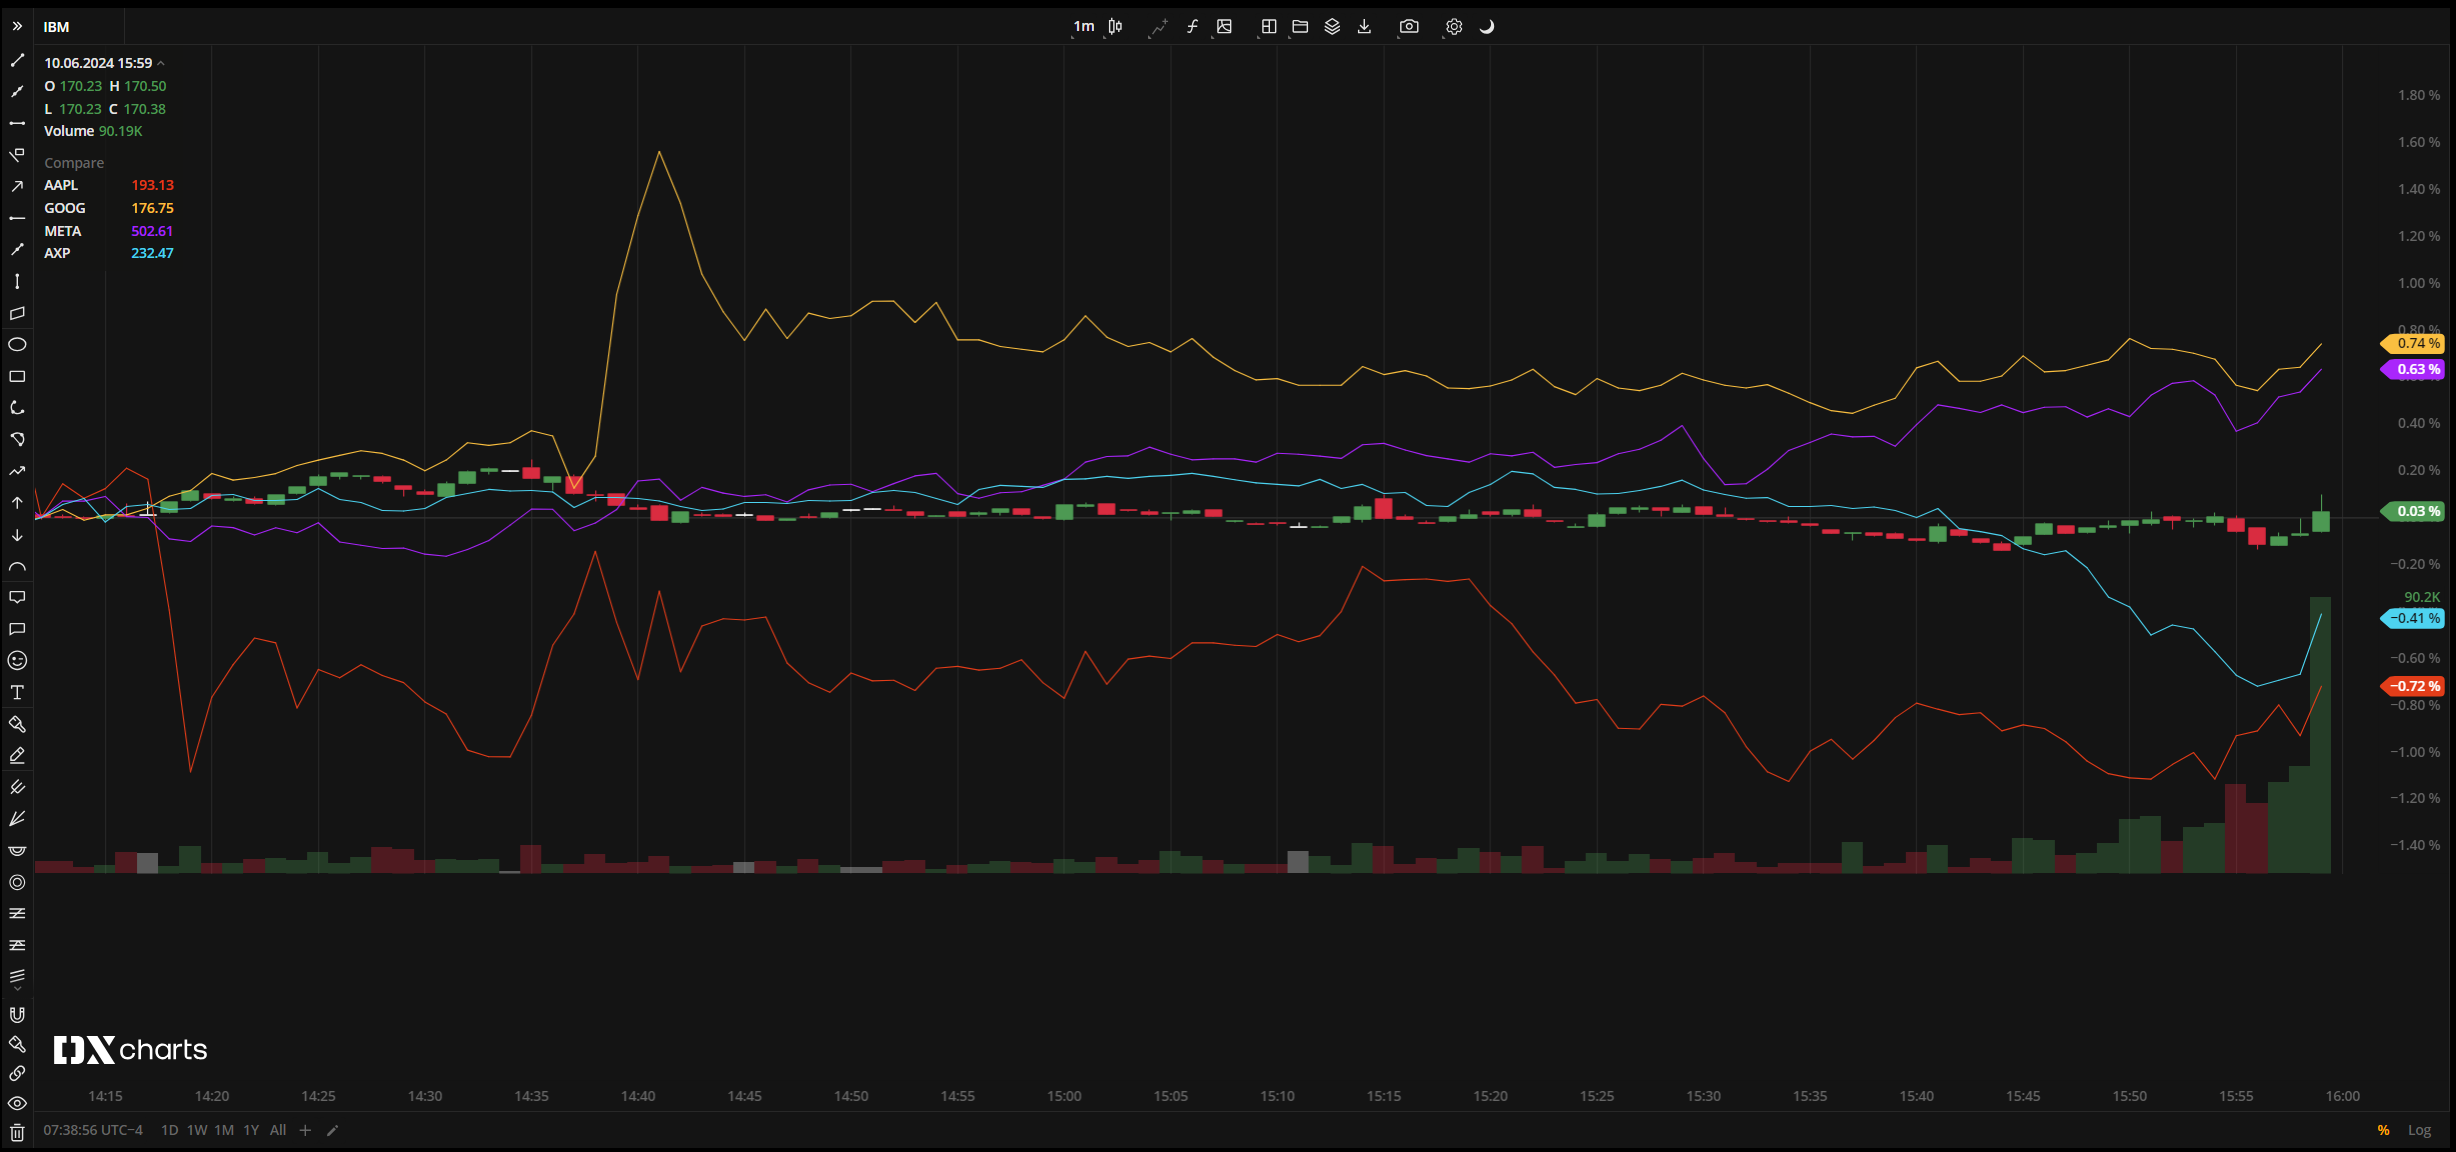
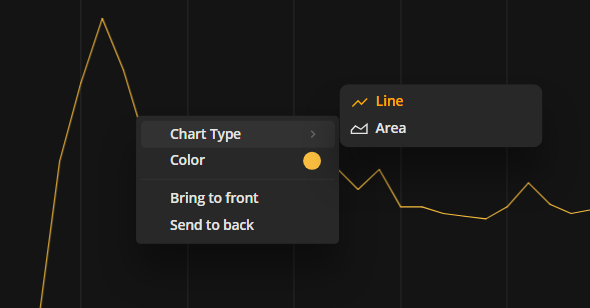
There are two types of charts to choose from for each instrument being compared: Line and Area. You can change the settings of the plots from the Compare box or from the shortcut menu by right-clicking on any plot in the chart. There you can also change a color or move the plot forward or backward: Bring to front and Send to back.
You will notice that the price scale automatically switches to percentage mode, but in the Compare box, you can see the exact price value for each symbol. The value corresponds to the point where the crosshair is positioned.
The Multichart and Compare charts features can turn your workspace into a Swiss army knife that makes your trading routine more manageable. To take full advantage of these features, we encourage you to experiment with different chart settings, data, and instruments on our DXcharts demo.
Stay tuned for our next article where we’ll continue to explore the features and tools of DXcharts.