DXcharts Tools: Indicator Settings and Custom dxScript Indicators

See all our DXcharts guides here.
Welcome to the fourth article in our series of guides. In these guides, we’ve been exploring the DXcharts features. This time we will take a closer look at indicators and their settings. We will also explore adding custom indicators using the dxScript language.
Read on to learn about the different types of indicators available in DXcharts and discover new ways to streamline your trading experience.
Predefined set of indicators
DXcharts comes with nearly 100 predefined ready-to-use technical indicators. Each indicator can be used independently or in combination to perform technical analysis on the charts.
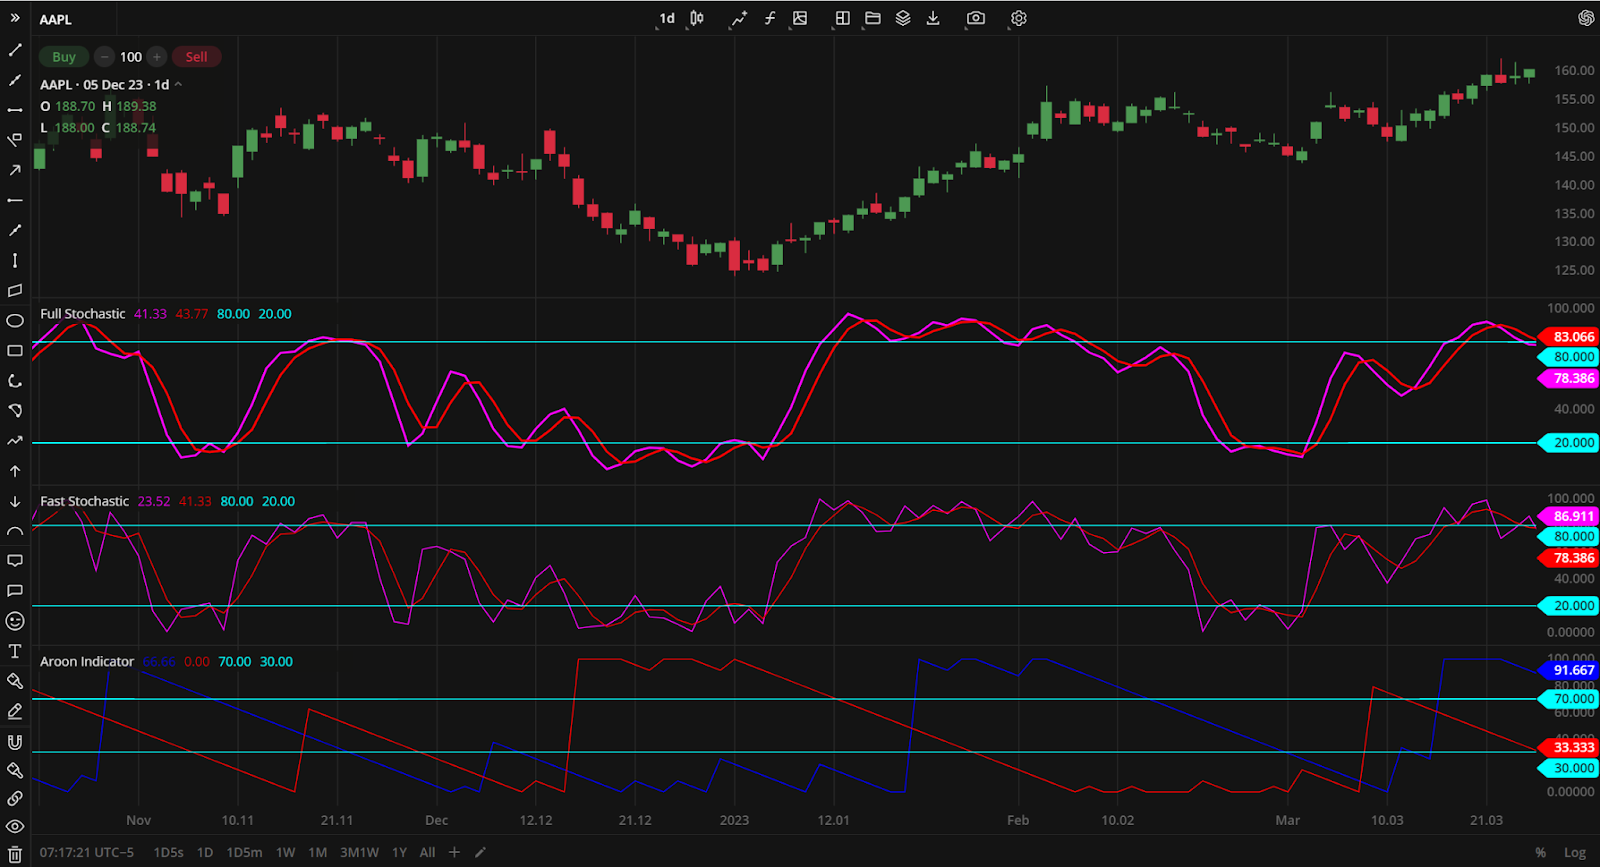
Indicators vary according to their type, which is usually evident from their name. These include Moving Average, Index, Oscillator, Bands, Trend, Stochastic, Range, Volatility, and more. Each type has its own specific trading logic and purpose, try them all out in our DXcharts demo page.
Indicator settings
Each indicator comes with settings that allow you to configure initial parameters, specify plot types, and adjust the color and weight of the plots. There are INPUTS and PLOTS settings that can be customized.
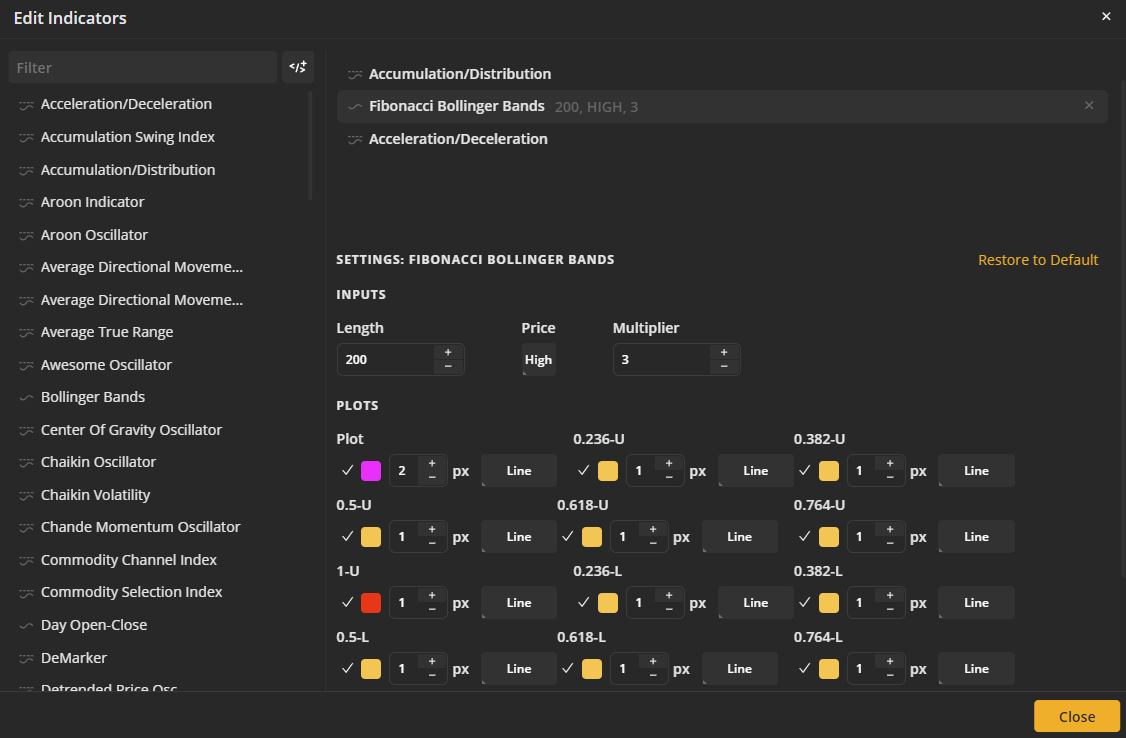
The INPUTS are the initial data series on which the plots are based. The set of inputs depends on a particular indicator.
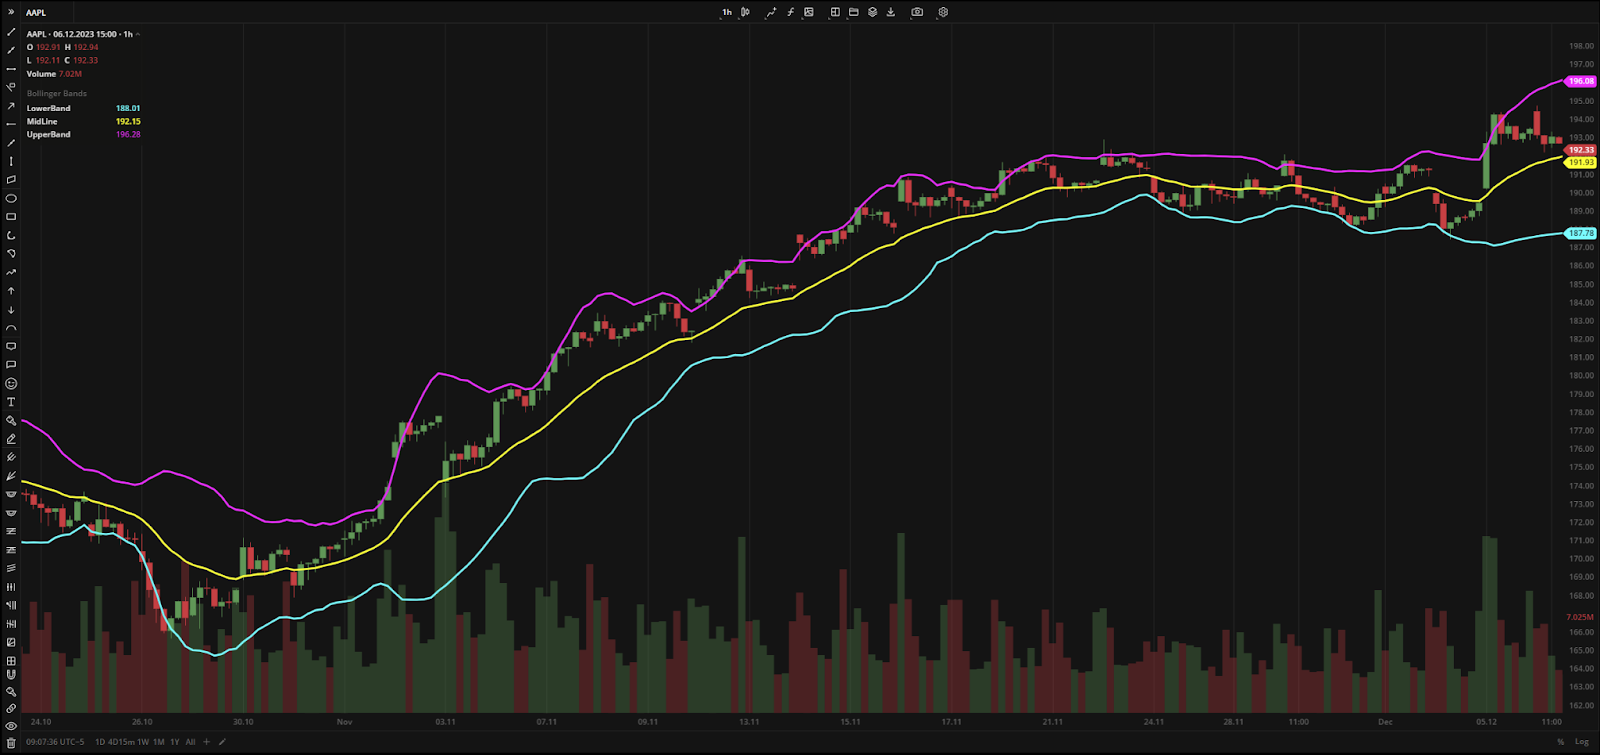
Example. Bollinger Bands inputs
| Input | Description |
| Length | The number of periods the indicator uses to calculate the MidLine |
| Displace | The number of bars to be shifted |
| NumDevDown | The standard deviation value (in points) to plot the LowerBand |
| NumDevUp | The standard deviation value (in points) to plot the UpperBand |
| Price | The source for the price value to calculate the MidLine:Open. The Open Price of every bar for the specified period.High. The High Price of every bar for the specified period.Low. The Low Price of every bar for the specified period.Close. The Close Price of every bar for the specified period.Median. The Median Price of every bar for the specified period – (High + Low) / 2.Typical. The sum of High, Low, and Close prices divided by 3 for the specified period – (High + Low + Close) / 3.OHLC average. The arithmetical mean of High, Low, Open, and Close prices for the specified period – (Open + High + Low + Close) / 4.Volume. The Close Price of every bar + average volume of an asset for the specified period. |
| Average | The type of Moving Average applied to the MidLine:Simple. Simple Moving Average (SMA).Wilders. Wilders Smoothing.Weighted. Weighted Moving Average (WMA).Exponential. Exponential Moving Average (EMA). |
The PLOTS serve as visual representations of the data displayed on the chart. You can change the following parameters of the plot in the settings: color, weight and type. Additionally, you can choose whether to show or hide a plot.
Example. Bollinger Bands plots
| Plot | Description |
| LowerBand | The lower deviation from the MidLine |
| MidLine | The middle line |
| UpperBand | The upper deviation from the MidLine |
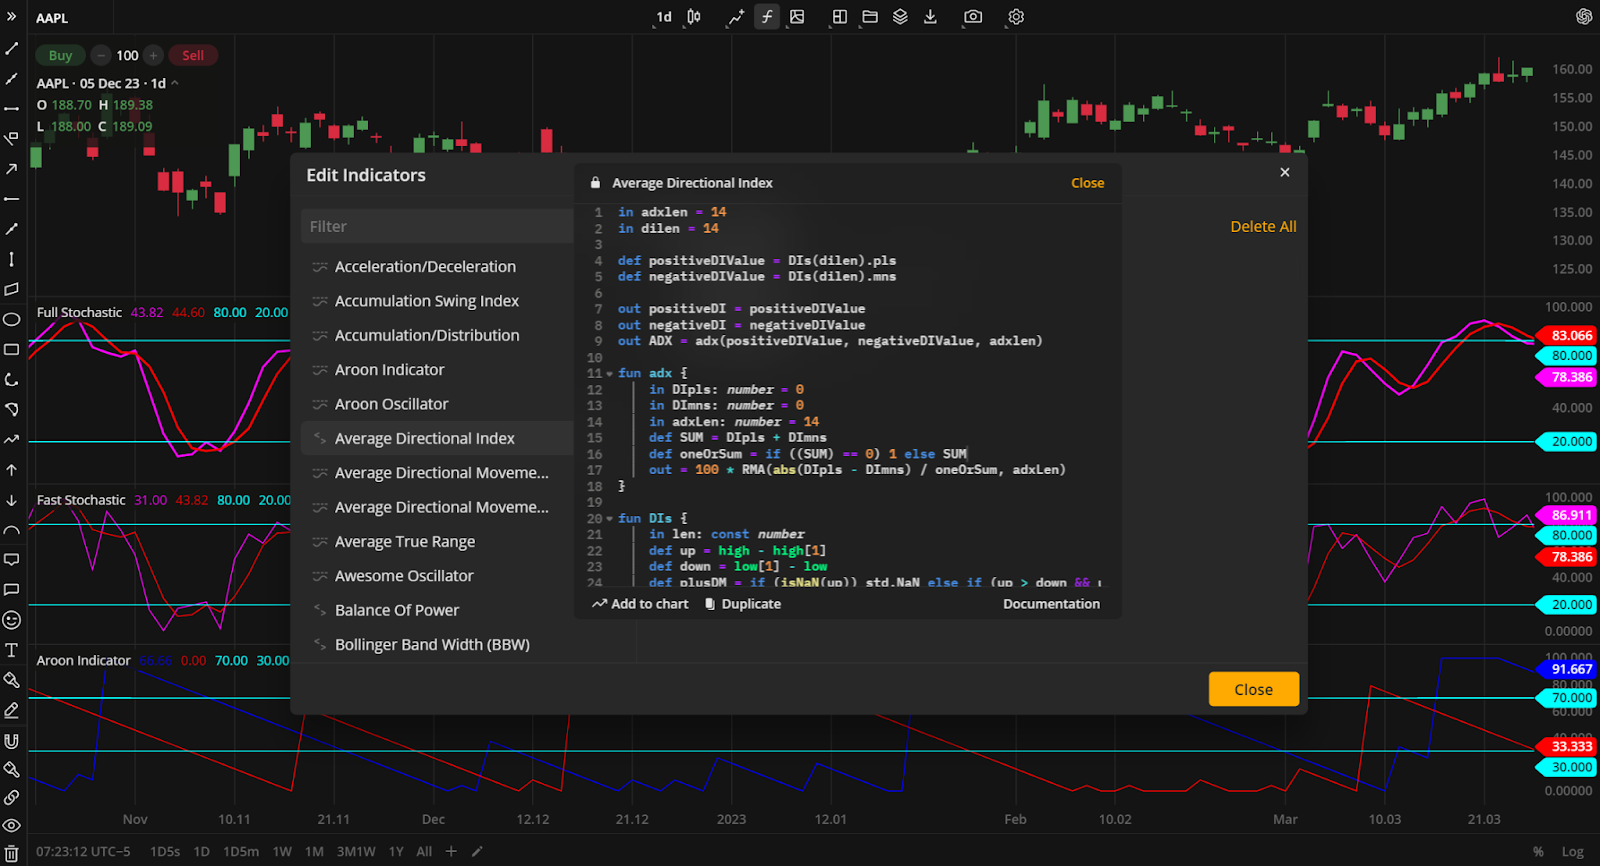
Custom indicators
DXcharts also allows you to create custom indicators through our proprietary language – dxScript. This domain-specific language is used to transform one data series into another. Designed for traders with no programming experience, dxScript has a clear and simple structure that allows traders to easily understand the scripts they create. In addition, the language comes with documentation that makes the process of creating indicators easier and more straightforward.
Once a custom indicator is saved, it can be duplicated to test the slightly modified version without removing the previous one. This allows traders to experiment and share their custom scripts with each other.
Whether you’re a new trader or want to expand your knowledge, our series of articles is designed to give you the guidance you need to use DXcharts successfully. Feel free to continue exploring technical analysis tools with us.
We hope this article has given you a better understanding of the indicators in DXcharts.