Modernizing Trading Education with Smarter Charting Tools

Most trading education platforms have a charting module. Some are basic, some are better. But nearly all of them share one thing in common: they weren’t designed with education in mind.
While trading platforms continue to evolve for professionals, adding speed, depth, and analytics, educators are often left working around charting limitations. Teaching technical analysis still too often means showing screenshots, copying candlestick patterns into slides, or jumping between a platform and external tools just to explain basic concepts.
We think it’s time charting caught up with the needs of educators.
That’s why we’ve created a short PDF: “The Future of Trading Education: Advanced Data Visualization with DXcharts”. It outlines how a smarter charting tool—built with education in mind—can solve daily pain points for instructors and enhance the learning experience for students.
The PDF introduces a set of features we’re rolling out in DXcharts, our financial charting library. All of them are designed to make technical analysis easier to teach, explore, and understand. If you work in trading education—whether you’re running your own learning platform, offering training to clients, or building a curriculum into a trading app—this is worth a look.
Here’s what’s inside:
Pattern recognition using historical data
Spotting patterns like flags, triangles, or double tops is fundamental to technical analysis. But learning to recognize them takes time and exposure. DXcharts introduces automatic pattern recognition on historical market data, so students can scroll back and study how these setups played out in real time. Educators can also use this to quickly demonstrate key patterns without building them from scratch.
Draw-to-pattern conversion
Need to explain how a head & shoulders looks on a real chart? Just draw the shape roughly and DXcharts will match it with a candle-based formation pulled from actual historical data. This makes on-the-fly explanations much easier and helps learners connect abstract shapes to real-world behavior.
Built-in lessons with real-time chart context
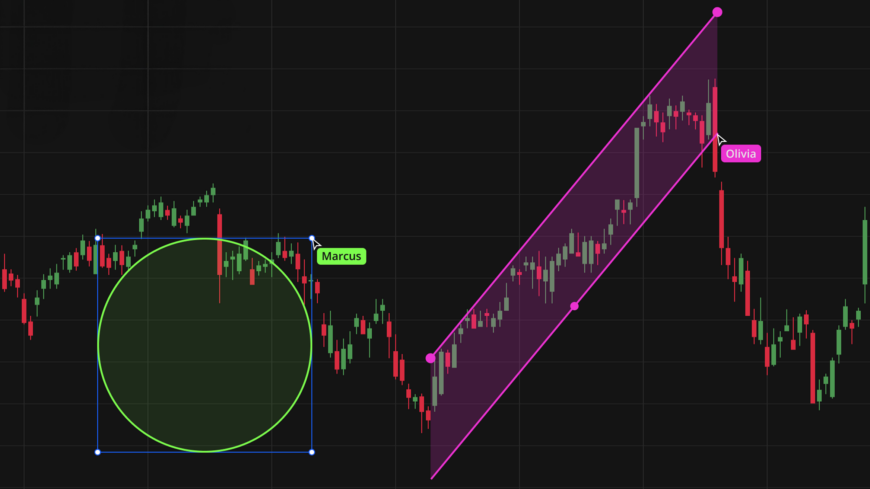
Instead of jumping between a learning platform and a trading interface, DXcharts lets educators embed lessons directly into the charting environment. You can explain what a candlestick means, highlight trends, or annotate live setups—all from within the chart. Content can be imported from Notion, Confluence, or Miro. If you don’t have your own materials, we offer a technical analysis knowledge base to get you started.
Collaboration mode
Learning to trade is often a solo activity, but it doesn’t have to be. With real-time collaboration (similar to Miro or Figma), students and instructors can analyze charts together, identify patterns, and even simulate trades using paper money. It’s designed to make group learning and coaching more effective, whether you’re in the same room or halfway around the world.
Stories-style market summaries
DXcharts also includes a story-like interface (think Instagram or LinkedIn Stories) that gives personalized updates on instruments a student is following. These short summaries highlight what’s been happening, what the current sentiment is, and what market data may suggest next. The goal is to keep students engaged with the market in a lightweight, habitual way, without needing to dive deep every time.
Who is this for?
This PDF is aimed at trading education providers: platforms, brokers, or independent educators who want to offer a more interactive and insightful experience. Many of our existing clients already offer trading functionality—our goal is to make the charting layer more useful for educational workflows.
If you’re building or running a trading education platform and want to talk shop, get in touch with our team. We’d love to hear how you’re teaching the next generation of traders.