
On Balance Volume (OBV) is a momentum indicator that uses volume flow to predict changes in a security price. The OBV values are calculated as the cumulative total of the up and down volume. When the close is higher than the previous close, the volume is added to the running total (up-volume), and when the close is lower than the previous close, the volume is subtracted from the running total (down-volume). If the price moves before OBV, it's a "non-confirmed" move which is tend to occur at bull market tops or at bear market bottoms. A series of rising peaks, or failing troughs in OBV indicates a strong trend. If OBV is flat, then the market is not trending.
1. If today's close is greater than yesterday's close then:
OBV = Yesterday's OBV + Today's Volume
2. If today's close is less than yesterday's close then:
OBV = Yesterday's OBV - Today's Volume
3. If today's close is equal to yesterday's close then:
OBV = Yesterday's OBV
 On Balance Volume
PLOTS
The plot renders the data you are working with on the chart. You can show/hide a plot by clicking the corresponding item in the settings. Every plot has a set of basic settings that you can change: color, weight, and type.
| Plot | Description |
|---|---|
| OBV | The On Balance Volume plot |
| Color |
|---|
Click the color rectangle under the plot's name to open the palette. Use the slider at the bottom to set the opacity of the color. 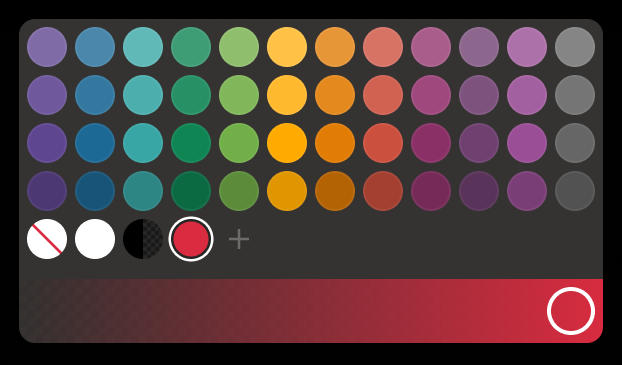 Palette To create a custom color:
The custom-created colors are added to your palette. To remove a custom color, drag it out of the palette. |
| Weight |
| Change the value (in px) to adjust the thickness of the plot. |
| Type |
The following plot types are available:
|
 to open the color picker
OVERLAYING
Check Overlaying to display the indicator on the chart. Otherwise, the indicator is shown in a study pane down below.