
Parabolic SAR (Stop and Reverse) is a trend-following indicator that can be used to set a trailing stop or determine entry/exit points. The SAR follows prices as they move up or down and indicates the "stop and reverse" points (dots) on the chart. When the dots are below prices, SAR signifies the bullish trend, when the dots are above prices, the market is bearish.
Uptrend: SAR + Prior AF (Prior EP - Prior SAR)
Downtrend: SAR - Prior AF (Prior SAR - Prior EP)
where:
EP – Highest high for an uptrend and lowest low for a downtrend, updated each time a new EP is reached
AF – Default of 0.02, increasing by 0.02 each time a new EP is reached, with a maximum of 0.20
 Parabolic SAR
INPUTS
| High |
|---|
The following data sources are available for high price:- Open. The Open Price of every bar for the specified period.
- High. The High Price of every bar for the specified period.
- Low. The Low Price of every bar for the specified period.
- Close. The Close Price of every bar for the specified period.
- Median. The Median Price of every bar for the specified period - (High + Low) / 2.
- Typical. The sum of High, Low, and Close prices divided by 3 for the specified period- (High + Low + Close) / 3.
- OHLC average. The arithmetical mean of High, Low, Open, and Close prices for the specified period - (Open + High + Low + Close) / 4.
- Volume. The Close Price of every bar + average volume of an asset for the specified period.
|
| Low |
|---|
The following data sources are available for low price:- Open. The Open Price of every bar for the specified period.
- High. The High Price of every bar for the specified period.
- Low. The Low Price of every bar for the specified period.
- Close. The Close Price of every bar for the specified period.
- Median. The Median Price of every bar for the specified period - (High + Low) / 2.
- Typical. The sum of High, Low, and Close prices divided by 3 for the specified period- (High + Low + Close) / 3.
- OHLC average. The arithmetical mean of High, Low, Open, and Close prices for the specified period - (Open + High + Low + Close) / 4.
- Volume. The Close Price of every bar + average volume of an asset for the specified period.
|
PLOTS
The plot renders the data you are working with on the chart. You can show/hide a plot by clicking the corresponding item in the settings. Every plot has a set of basic settings that you can change: color, weight, and type.
| Plot | Description |
|---|
| SAR | The SAR plot |
| Color |
|---|
Click the color rectangle under the plot's name to open the palette. Use the slider at the bottom to set the opacity of the color. 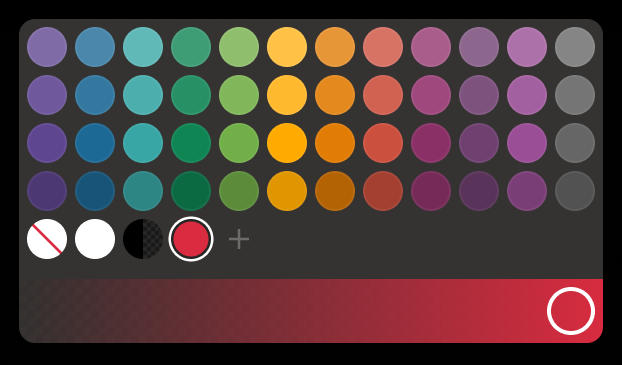 Palette To create a custom color: - Click
 to open the color picker - By using the slider at the bottom, adjust the main color
- Then, set a shade for the main color on the palette
The custom-created colors are added to your palette. To remove a custom color, drag it out of the palette. |
|
| Weight |
|---|
| Change the value (in px) to adjust the thickness of the plot. |
| Type |
|---|
The following plot types are available:- Linear. The plot is displayed as a line.
- Column. The plot is displayed as a histogram.
- Difference. The plot is displayed as a line which represents the difference between High and Low prices of the bar.
- Points. The plot is displayed as points.
- Text above candle. The plot is displayed as the price labels above candles on the chart.
- Text below candle. The plot is displayed as the price labels below candles on the chart.
- Triangle above candle. The plot is displayed as triangles above candles on the chart.
- Color candle. The candles on candle-type charts are highlighted with specified colors.
|
OVERLAYING
Check Overlaying to display the indicator on the chart. Otherwise, the indicator is shown in a study pane down below.
Note: To reset the settings, click Restore to Default next to the SETTINGS: INDICATOR'S TITLE