
The Standard Error Bands (SEB) indicator shows the direction of the current trend by plotting a linear regression average value (middle line) and the volatility deviation by plotting upper and lower bands. The deviation from the linear regression indicates increased volatility and risk. The indicator is similar to Bollinger Bands (BB) with the only difference that SEB uses smoothed linear regression instead of moving average that is used in BB.
The middle line is calculated as the linear regression for each bar:
y = a + bx
b = (nΣxy - ΣxΣy) / ( nΣx2 - (Σx)2 ))
a = (Σy - bΣx) / n
where:
y – the data price source
x – the number of bars
a – the constant (the value when x equals zero)
b – the slope of the line
n – the number of data points selected
The standard error bands are calculated as follows:
UpperBand = MidLine + 2 x StdError
LowerBand = MidLine - 2 x StdError
where:
StdError – the aproximate standard deviation
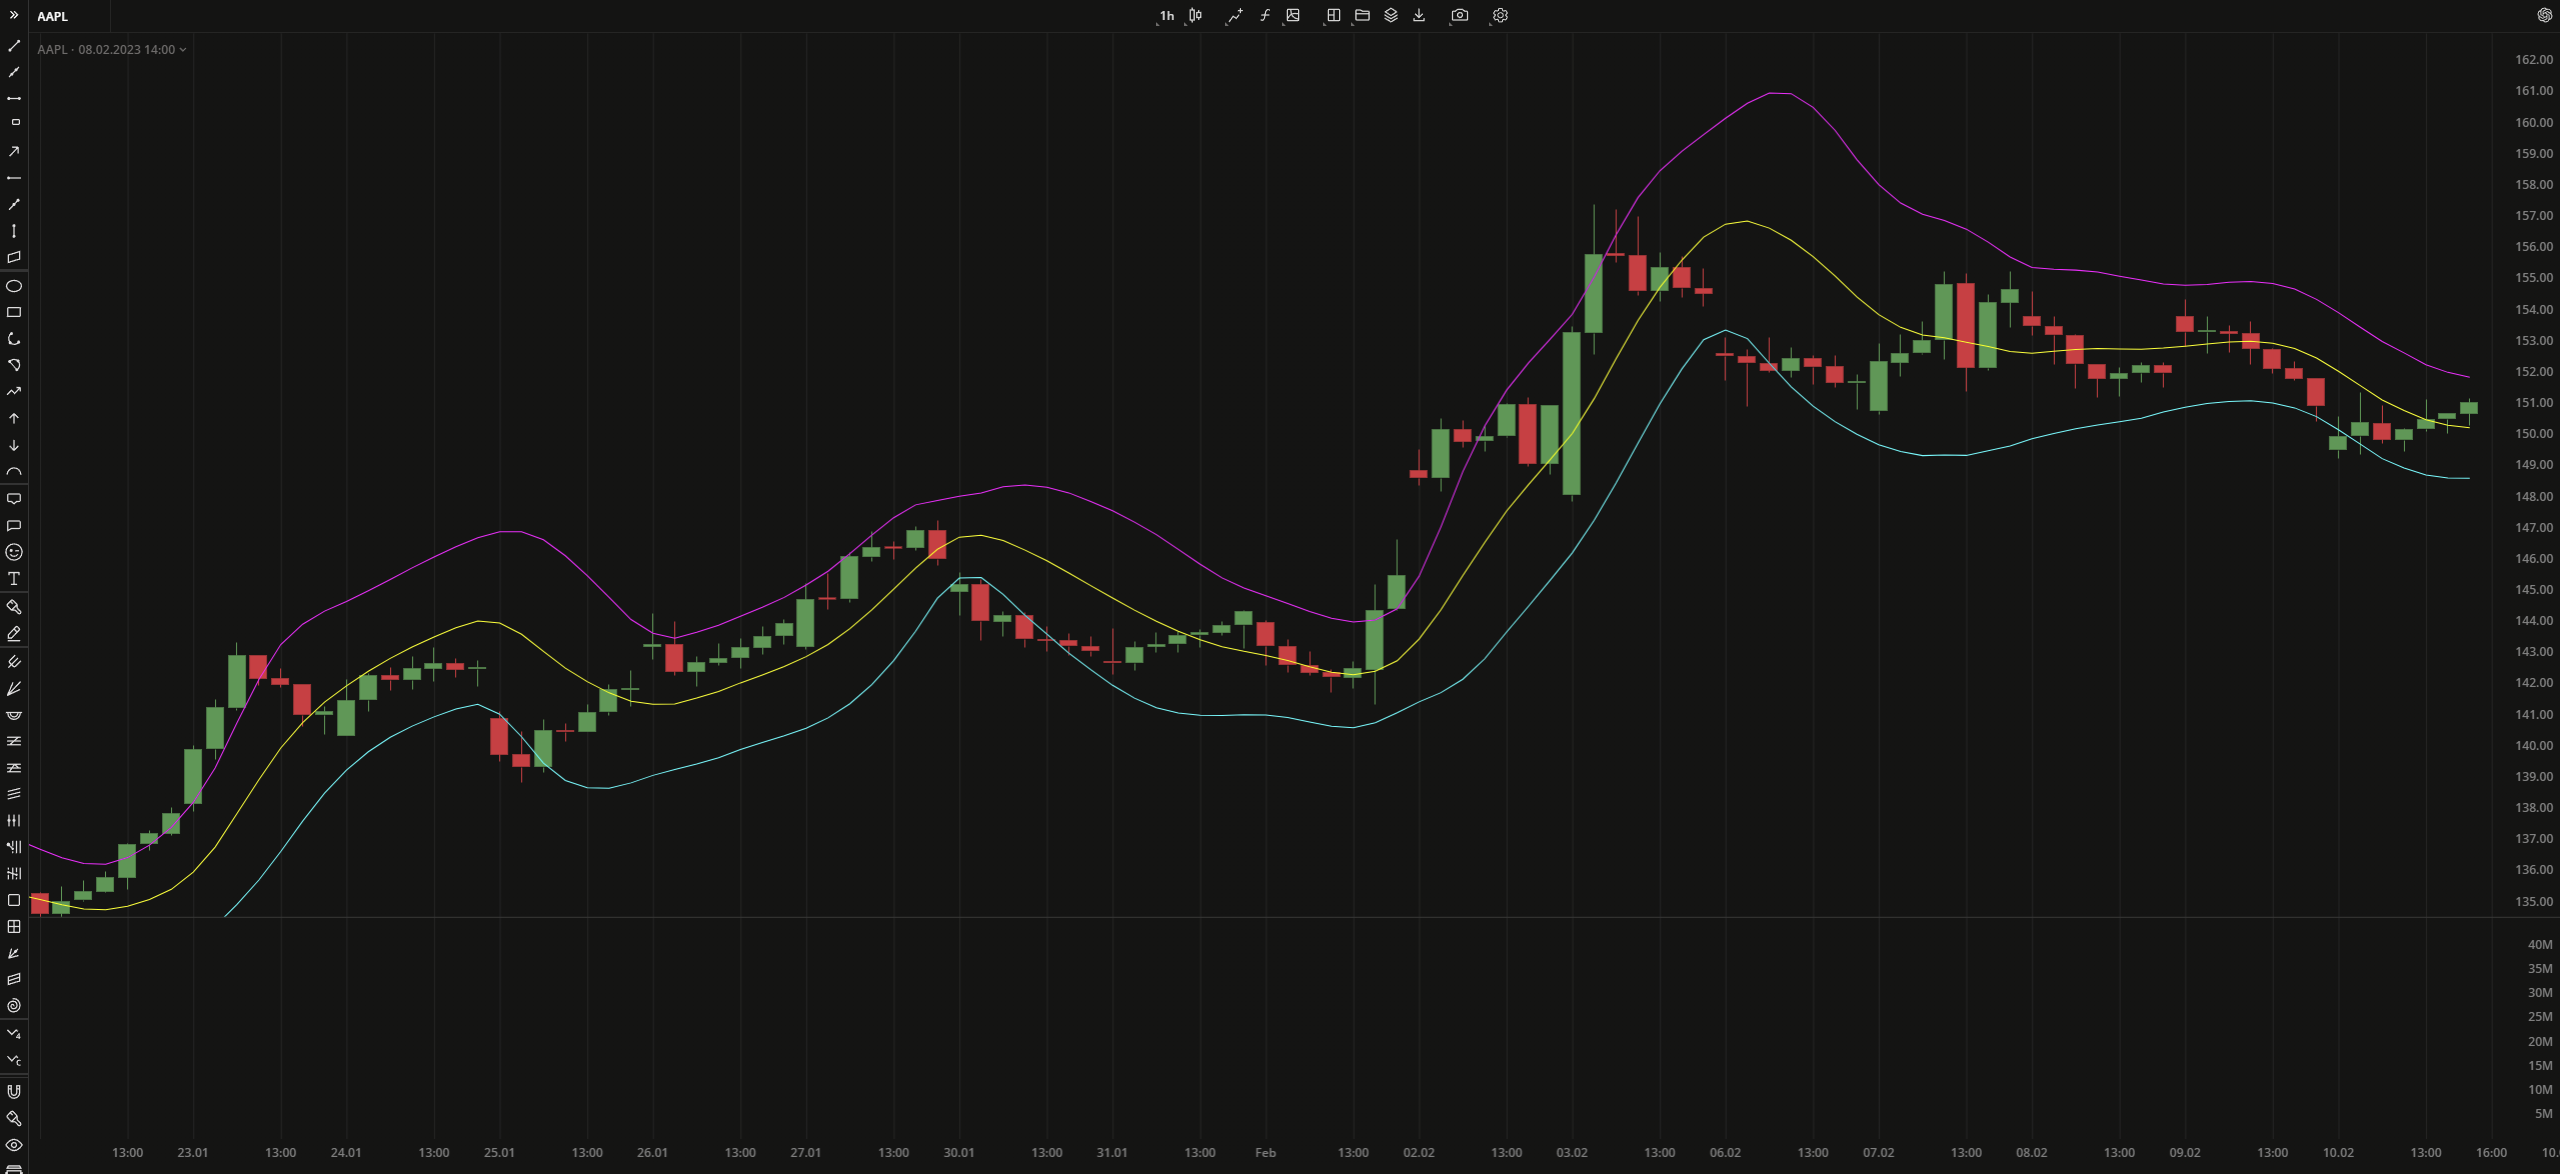 Standard Error Bands
INPUTS
| Price |
|---|
The following data sources are available for the price:
|
| Input | Description |
|---|---|
| Displace | The displacement of the indicator in bars |
| LinRegLength | The number of bars used to calculate the Linear Regression (MidLine) |
| SmLength | The number of bars used to smooth the Linear Regression (MidLine) |
| NumDevUp | The multiplier for the stardard error band used in the upward shift calculation |
| NumDevDown | The multiplier for the standard error band used in the downward shift calculation |
PLOTS
The plot renders the data you are working with on the chart. You can show/hide a plot by clicking the corresponding item in the settings. Every plot has a set of basic settings that you can change: color, weight, and type.
| Plot | Description |
|---|---|
| LowerBand | The lower standard error band |
| MidLine | The Linear Regression plot |
| UpperBand | The upper stardard error band |
| Color |
|---|
Click the color rectangle under the plot's name to open the palette. Use the slider at the bottom to set the opacity of the color. 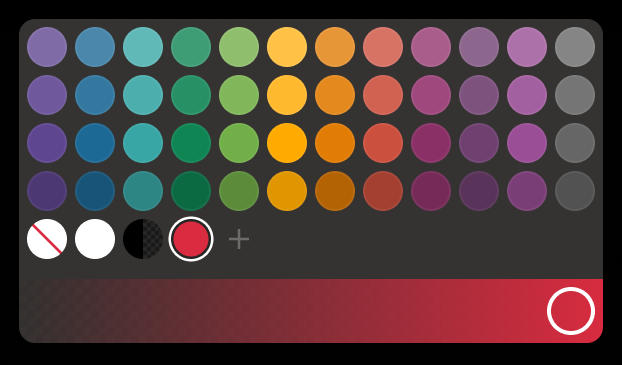 Palette To create a custom color:
The custom-created colors are added to your palette. To remove a custom color, drag it out of the palette. |
| Weight |
| Change the value (in px) to adjust the thickness of the plot. |
| Type |
The following plot types are available:
|
 to open the color picker
OVERLAYING
Check Overlaying to display the indicator on the chart. Otherwise, the indicator is shown in a study pane down below.