DXcharts Tools: Price Axis and Indicator Templates
See all our DXcharts guides here.
Here’s another enlightening guide from our series of articles dedicated to DXcharts, the ultimate financial charting library designed for stock, forex, and crypto enthusiasts. In this edition, we will explore the Price axis settings, and take a look at the possibility to save indicators in a bundle using Indicator templates.
Dive in and unlock the full potential of your charting experience!
Price axis
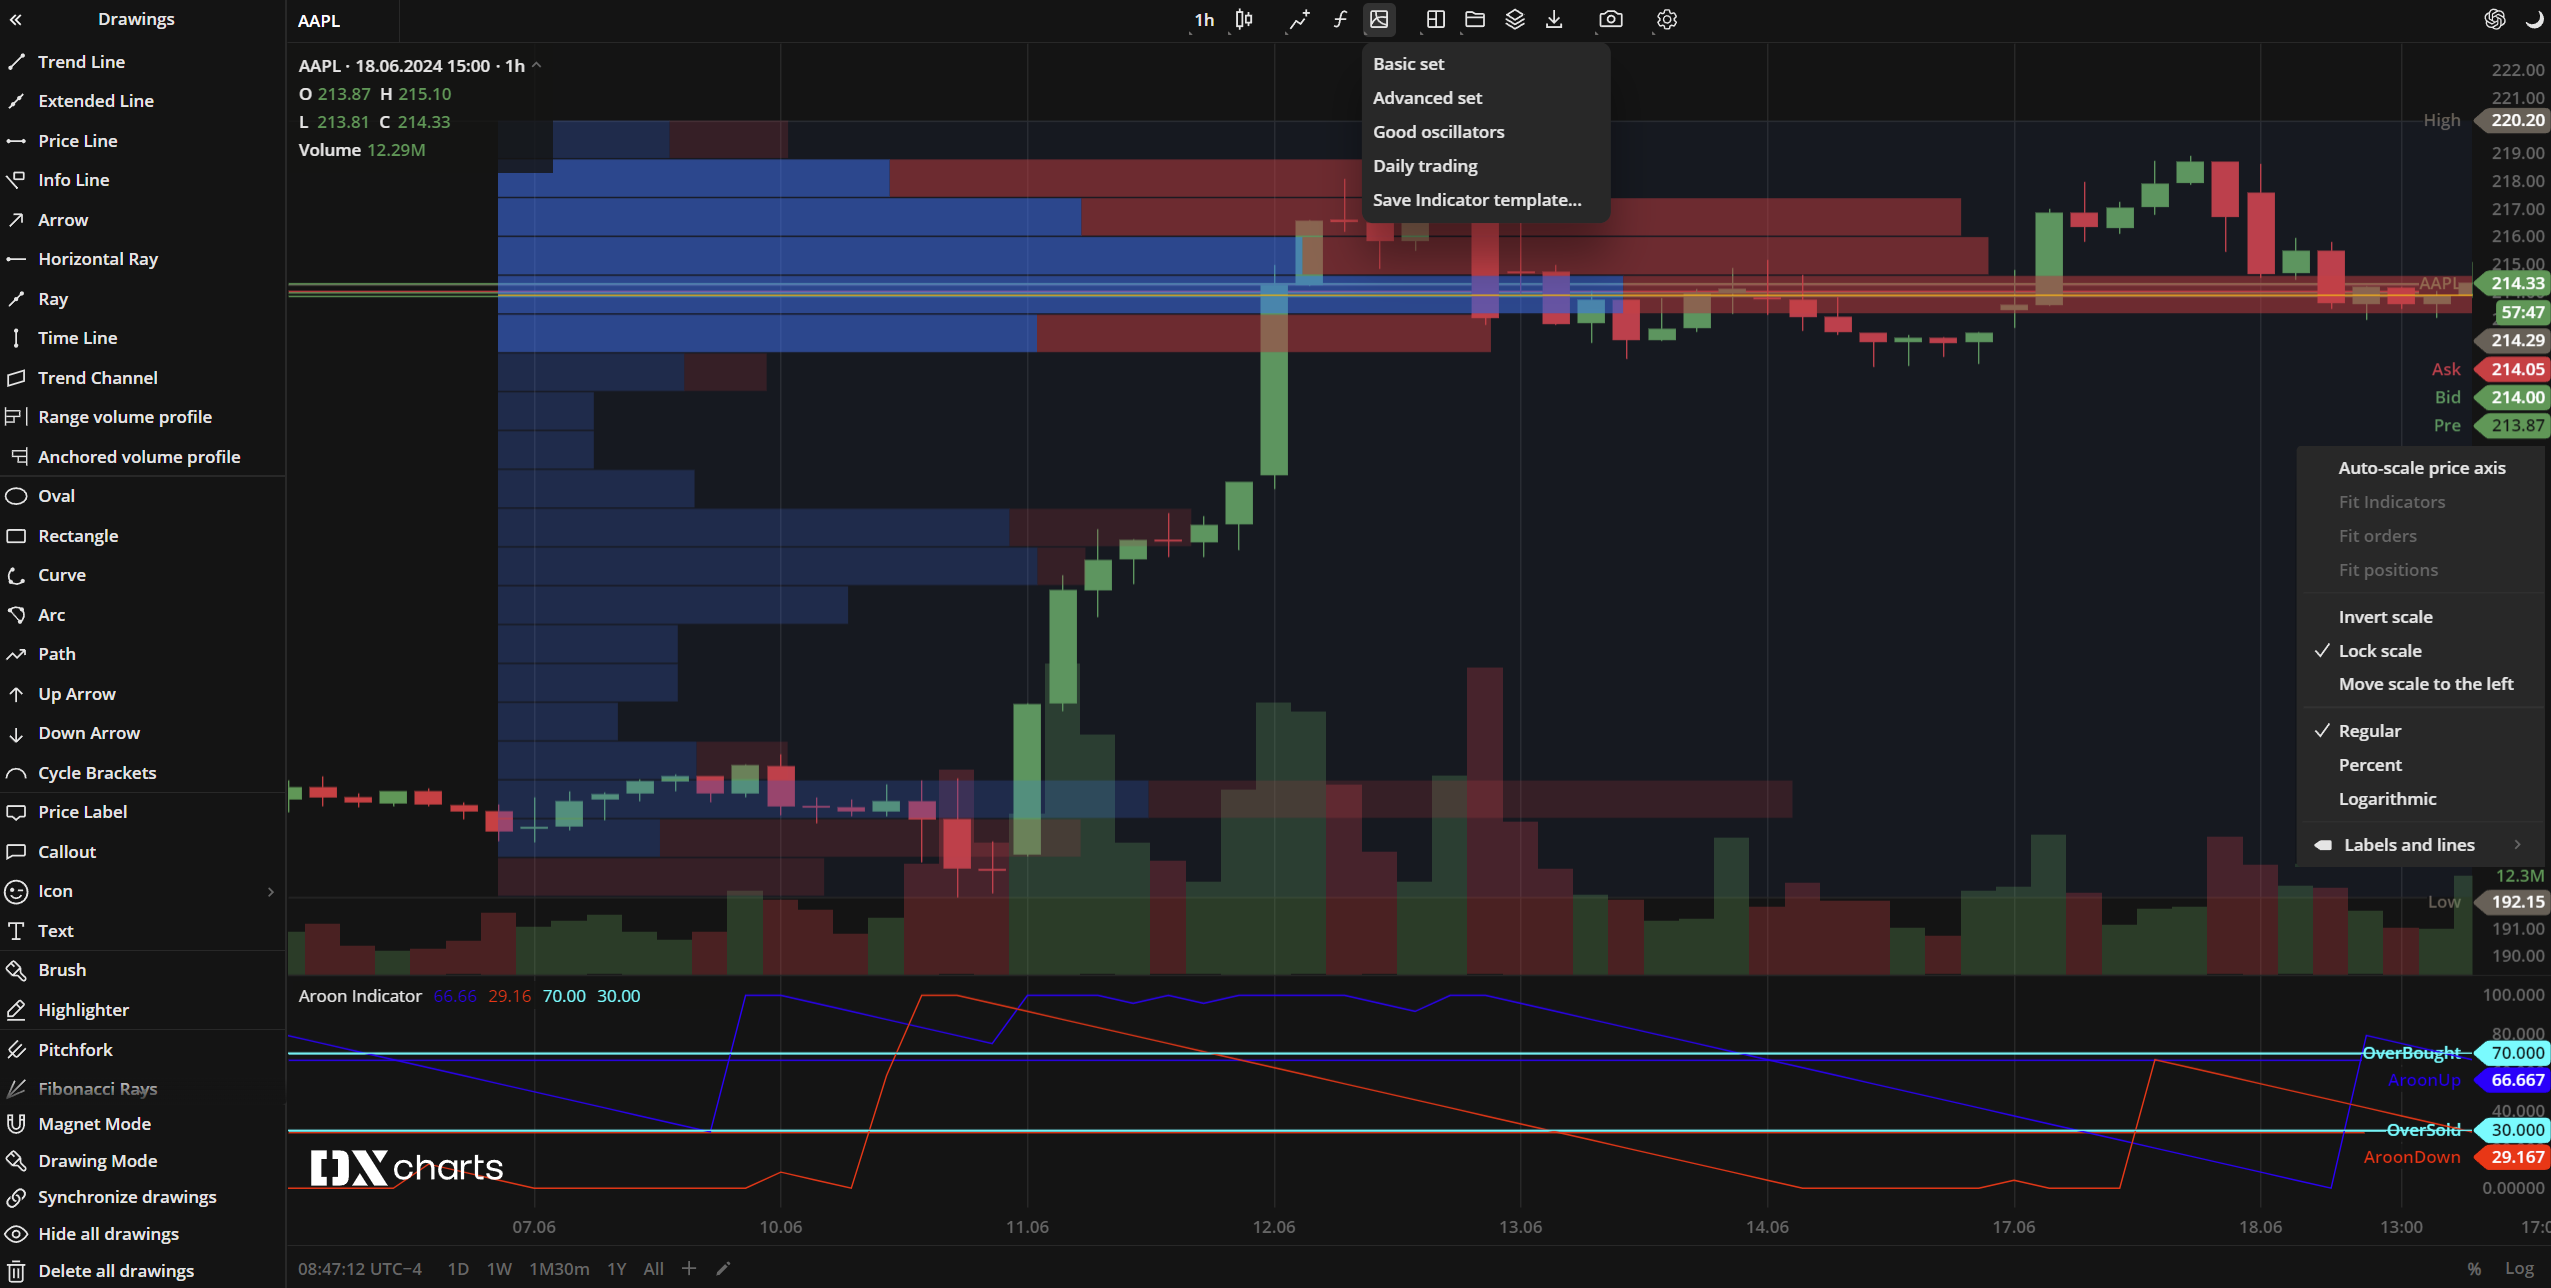
The price axis is a scale (Y-axis) used to represent the relationship between price and time. It can be customized to suit your charting needs. You can change the type of scale, its position, show labels and lines, invert the scale, move the scale to the left side of the charts, and much more.
There are three types of price scales available that you can switch between:
- Regular. The price values on the scale are evenly spaced from one another.
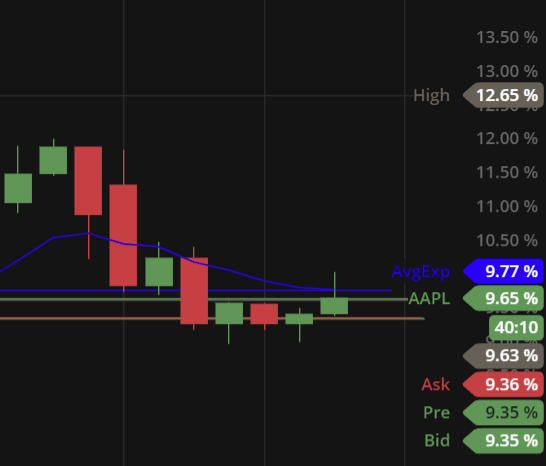
- Percent. The scale displays percentages, not price values. The chart represents OHLC prices as the percentage change, where 0% corresponds to the starting price of the first candle visible on the chart. The percentage price axis is generally used in Compare charts mode.
- Logarithmic. A logarithmic price scale represents the distance between values as proportional logarithms. This means that the prices are not equidistant, but are placed according to a logarithmic change between them.
Another setting is the Auto-scale mode. It suggests that the span of the price axis be defined automatically with additional choices:
- Fit indicators. Automatically scales the price axis so that all indicators are always fully visible.
- Fit orders. Automatically scales the price axis so that all working orders for the current instrument are always visible on the chart.
- Fit positions. Automatically scales the price axis so that all open position plates for the current instrument are always visible on the chart.
Actions with the price scale:
- Invert scale. Inverts the direction of the price axis.
- Lock scale. Locks the price axis so that it adjusts to the bars as you zoom in and out of the chart.
- Move scale to the left. Attaches the price axis to the left side of the chart.
Labels and lines
This is a menu that allows you to configure the display of additional marks and details on the price scale. Here you can choose to display only labels, only lines, both labels and lines, or none for the different chart elements:
- Symbol
- Indicators placed on chart
- Bid and ask prices
- High and low prices
- Previous day close
- Pre and post market close
You can also enable a text description for the labels or a counter for the last bar close:
- Descriptions
- Countdown bar close
The ability to customize your price scale can significantly reduce the time required to complete trading tasks and allow you to adjust the workspace to suit your preferred trading style.
Indicator templates
Indicator templates is a menu that allows you to save the indicators applied to a chart as a single template.
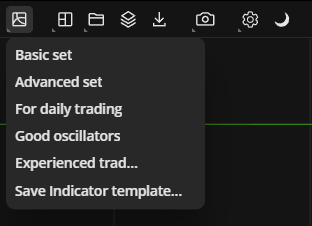
This template can then be applied to any chart with a single click. It makes it possible to have quick access to a set of your favorite indicators at the ready.

That’s it! We hope that this article has shed some light on the rich functionality that DXcharts has to offer.
Also, our next article is just around the corner, so stay tuned for more features and capabilities!
In the meantime, don’t forget to explore the DXcharts demo!