From SMA to Proprietary Studies: Building Custom Technical Indicators with DXcharts
Every trading platform comes with standard technical indicators such as SMA, EMA, RSI, MACD, and Bollinger Bands. DXcharts, our financial charting library, provides these out of the box. It also includes custom studies, which let your development team write custom technical indicators of the kind traders usually find only in desktop trading terminals.
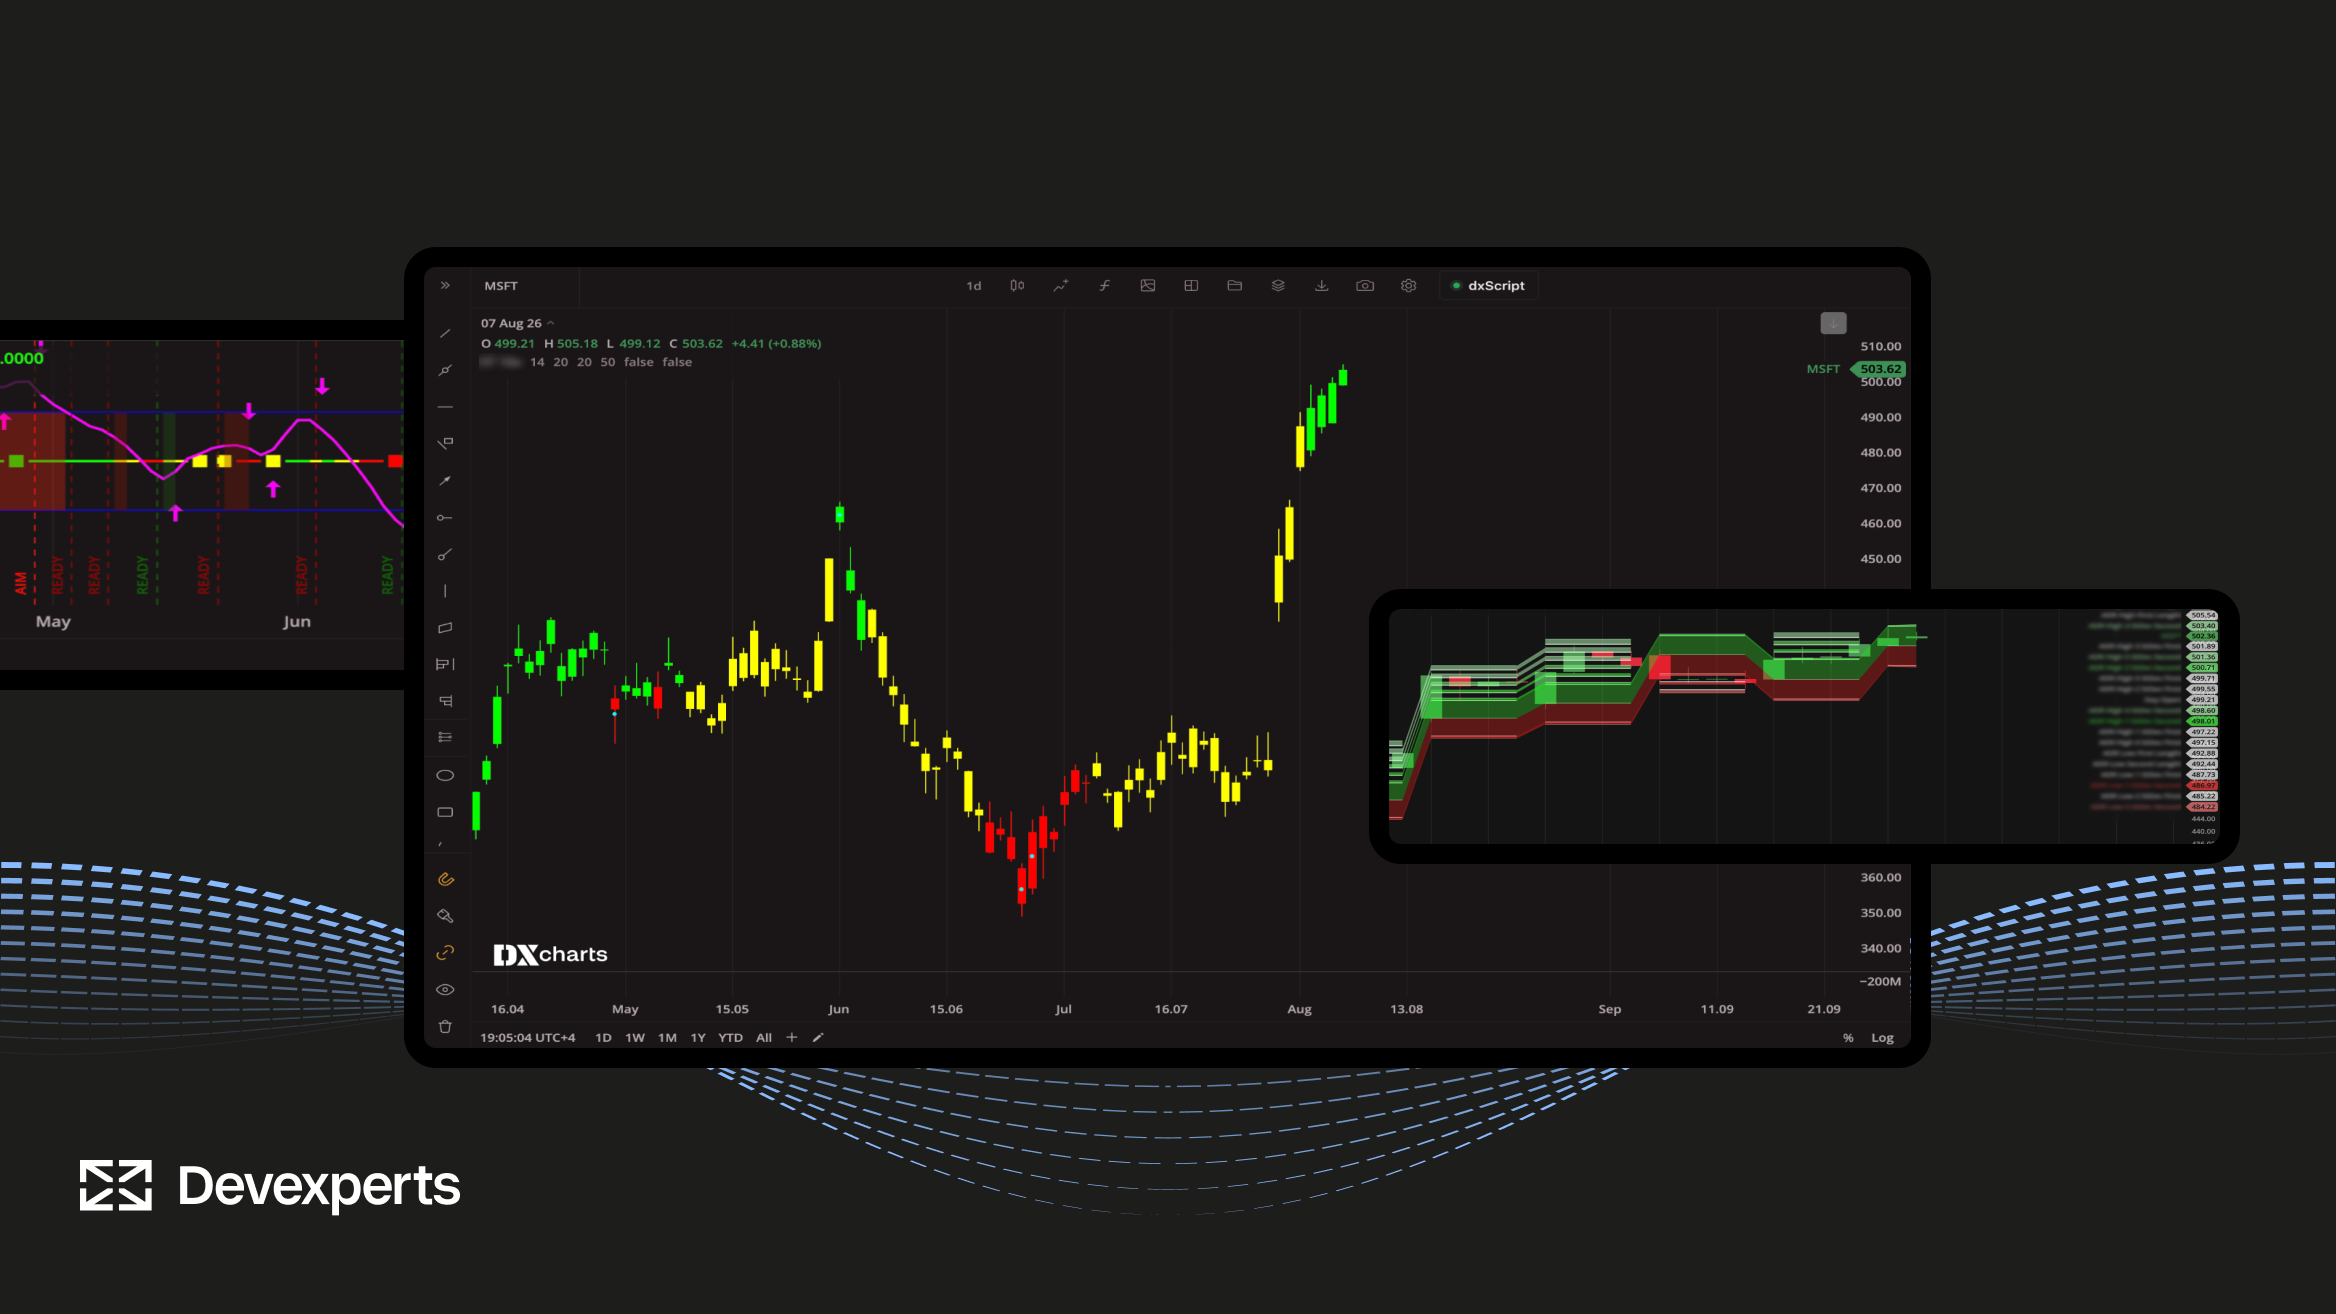
For brokers and prop firms, the analytics in your platform no longer depend on a fixed indicator list. You can build the studies your traders need and set your platform apart without extensive customization work.
Below, we walk through four sample studies built with DXcharts: a multi-timeframe range model, an implied-volatility projection, a trend system that colors the price candles, and a multi-signal momentum oscillator. Each one runs natively in the browser. First, we cover the building blocks your developers combine to create them.
The building blocks of a custom study
dxScript, the client-side scripting layer built on the DXcharts custom studies API, lets developers write custom technical indicators in JavaScript.
A dxScript Lite study has four parts:
- Parameters: the inputs a trader can change in the settings dialog.
- Plots: the visual outputs declared in the study’s metadata, such as lines and clouds.
- init(): an optional function for one-time setup, such as requesting data from another timeframe.
- main(): a function that runs once per bar and returns one value, or a styled object, for each declared plot.
The plot types and the drawing API define what a study can display. Developers combine the following building blocks as each indicator requires:
- UNIVERSAL_MARKER: a plot that combines a per-bar marker with an optional connecting line. It supports seven line styles (lineStyle: SOLID, SHORTDASHED, DOTTED, and four more) and 17 marker styles (markerStyle: DOT, SQUARE, DIAMOND, STAR, ARROW_UP, ARROW_DOWN, EXTENDED_DASH, and more). The script can override the styling of each bar individually.
- DIFFERENCE: a pair of plots with the area between them shaded. Use it to draw clouds and bands, for example, to highlight the range between two moving averages.
- VERTICAL_LINE: an event marker at a specific bar, with an optional text label and font size.
- drawings.label(…): a floating heads-up display (HUD) for live statistics and statuses.
- drawings.bubble(…): a callout anchored to a price level on a specific bar, with configurable text, color, placement, alignment, and style.
- chart.changeCandleColor(index, color): recolors the price candles based on conditions the script defines, so the price series itself shows the signal.
- context.alert(…): a platform alert that fires when predefined conditions are met.
- requestSecondaryData / secondaryData: lets the script use data from another symbol or timeframe in its calculations, for example daily levels on an intraday chart.
- input.impVolatility(): implied volatility data, available alongside open, high, low, close, and volume (OHLCV) data when the data feed supplies it.
- Parameter types: INTEGER_RANGE, DOUBLE_RANGE (with precision), ENUM, BOOLEAN, COLOR, STRING, DATE, and TIME. These give traders whole numbers within a min–max range, decimals with a fixed number of decimal places, predefined dropdowns, on/off switches, color pickers, free text, and calendar and clock inputs. Developers can group parameters into collapsible sections in the settings dialog.
- utils library: built-in functions for standard technical analysis calculations, including sma, ema, wma, rma, stdev, tr, atr, rsi, highest, lowest, and na, so developers do not have to write common formulas from scratch.
Sample 1. Multi-timeframe data and filled clouds: Daily Range Zones
This indicator projects the day’s expected range as bands centered on the day’s open. The bands sit at one to five times the average daily range or, with the Standard deviation option on, at one to five standard-deviation multiples. The result is a set of dynamic support and resistance levels that reset at the start of each trading session.
Intraday traders see daily reference levels without switching timeframes. The study subscribes to a secondary daily data stream in init(), so it calculates the levels on daily candles while the trader views them on an intraday chart:
 // in init():

context.requestSecondaryData("daily", { period: { duration: 1, durationType: "d" } });

// in main():

const dayOpen = context.secondaryData("daily").open(0);
The zones are DIFFERENCE plots with per-bar fill colors, and each band carries a dynamic line color so that each new trading day can be easily distinguished.
const AdrHighCloud_Upper = { value: adrHighFirst, color: cloudColor, fillColor: cloudColor };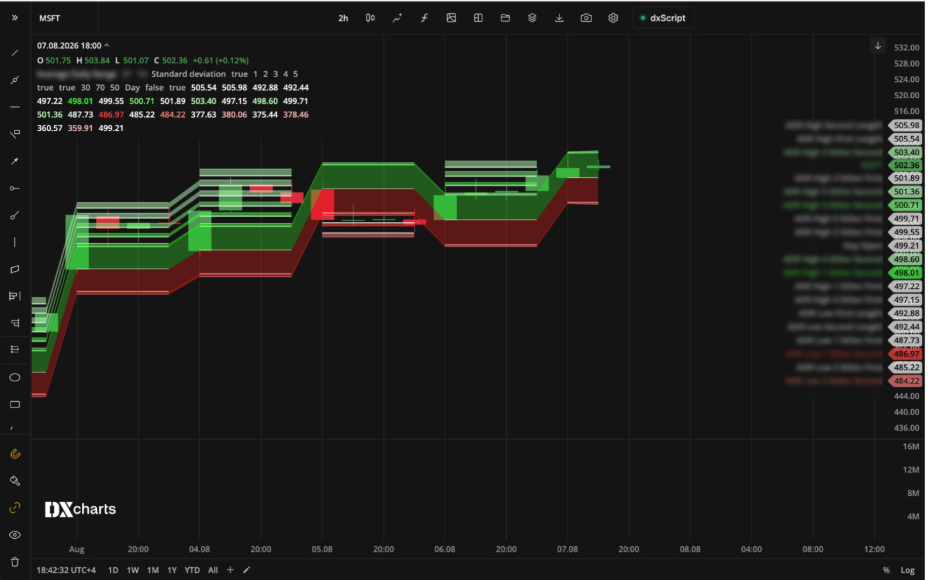
Sample 2. Implied volatility and on-chart statistics: Expected Move Bands
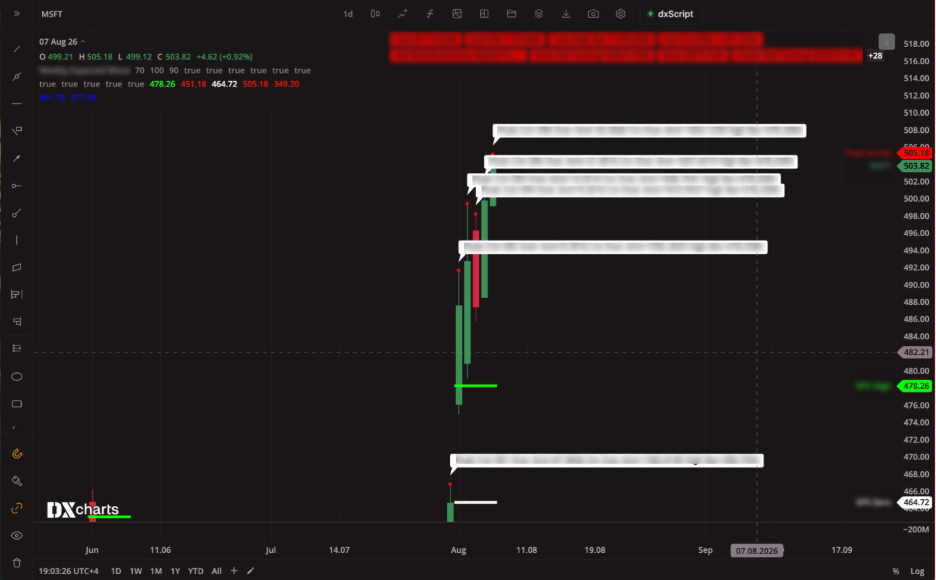
This study uses implied volatility to project the week’s expected high and low as a band. It then counts how often the price closes inside the band or breaks out of it. The study requires a data feed that supplies implied volatility, such as our market data subsidiary, dxFeed. For brokers that offer options, a study like this puts volatility analysis on the same chart as price action.
It uses IV input, bubbles, and live stat labels. The band is calculated using implied volatility data:
state.ivGapHi[index] = input.impVolatility(1);

state.expMove[index]  = input.close(1) * state.ivGapHi[index] * state.expMoveMultiplier;
Breakouts get callout boxes anchored to the relevant bar, and rolling statistics render as a live HUD presented above the main chart.
drawings.bubble(peak === 1, input.high() + 1, "Peak Cnt=" + count, "#FFFFFF",

 { placement: 'above', alignment: 'median', style: 'bubble' });

drawings.label(showDetail, "Over EM % " + pct, "#FF0000");
The band edges use UNIVERSAL_MARKER with markerStyle: EXTENDED_DASH and DOT.
Sample 3. Candle coloring and alerts: Trend-Colored Candles
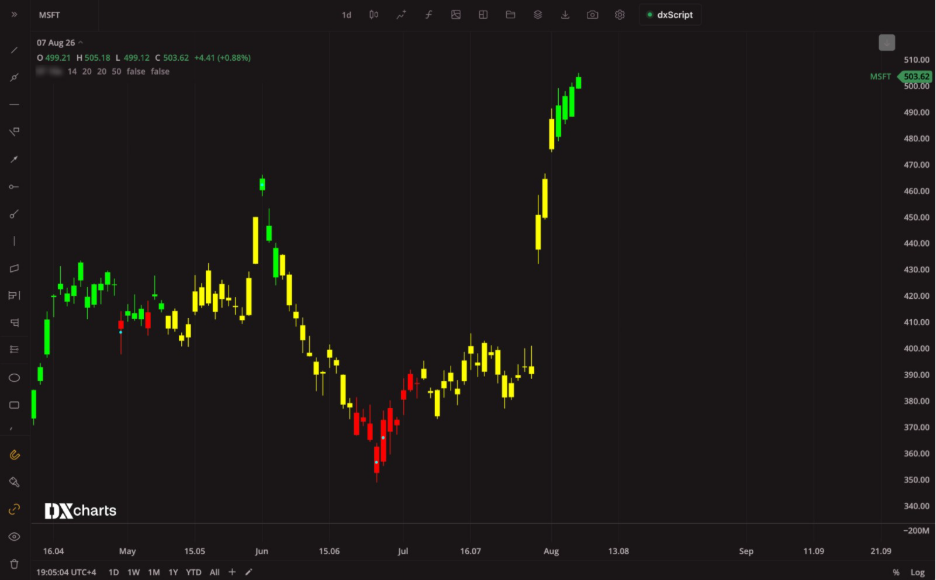
This indicator classifies the trend on every bar using the Directional Movement Index (DMI) and the Average Directional Index (ADX). When +DI is above −DI and ADX exceeds the trend threshold, the trend is bullish. When −DI is above +DI and ADX exceeds the threshold, the trend is bearish. The study recolors each candle to match and can send an alert when the trend turns. Traders can read the trend state directly from the price candles, without a separate indicator pane.
This indicator uses: candle repainting, COLOR parameters, the utils math library, and alerts:
const atr = utils.atr(parameters.DMIlength, index, "atr");

const [plusDI, minusDI, , adx] = utils.dmi(parameters.DMIlength, parameters.ADXlength, index, "dmi");

state.long[index] = plusDI > minusDI && adx > parameters.trendThreshold;

state.short[index] = minusDI > plusDI && adx > parameters.trendThreshold;

chart.changeCandleColor(index,

 state.long[index] ? parameters.colorBullish :

 state.short[index] ? parameters.colorBearish : parameters.colorNeutral);

context.alert(parameters.enableAlerts && state.long[index] && !prevLong,

 "Trend turned bullish", "CANDLE", "BELL");
Colors are fully user-configurable via type: “COLOR” settings with no hard-coded palette.
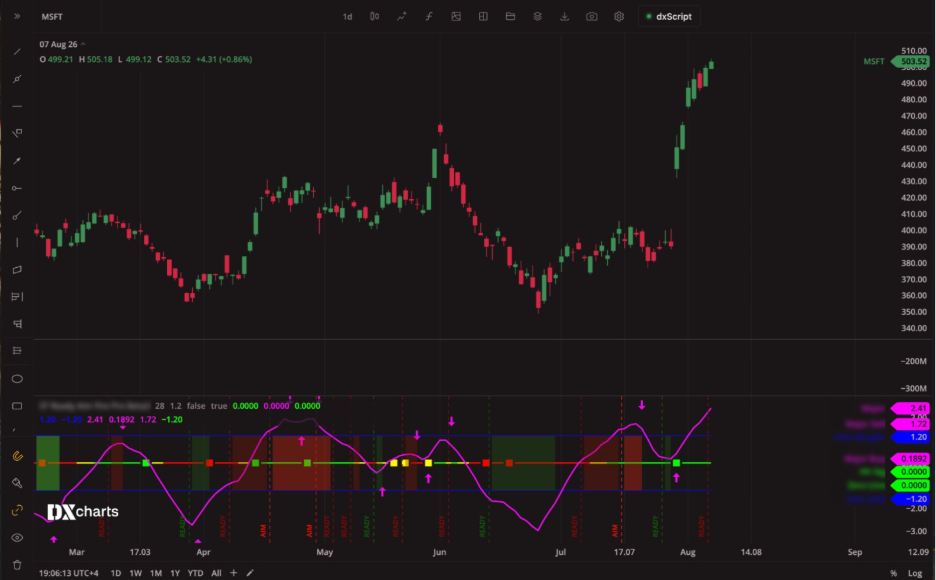
Sample 4. A full lower pane system: Three-Stage Momentum Oscillator
Three-Stage Momentum Oscillator is a three-in-one technical indicator that lives in a pane below the main chart (like RSI and MACD) and can be used as a complete trading system. This indicator uses a triple exponential moving average to reduce signal lag, a triple stochastic oscillator to smooth out false positives, and the Directional Movement Index to identify trends.
The study provides traders with a complete three-stage setup, with buy/sell clouds, directional arrows, and vertical event lines.
This indicator combines many of the building blocks described above: dynamic-color markers, DIFFERENCE clouds, and VERTICAL_LINE events that carry a text label:
// plot declaration

{ id: "stage", title: "Stage", type: "VERTICAL_LINE", lineStyle: "SHORTDASHED" }

// per bar: a labeled vertical event, colored by stage

const stage = {

 value: fired ? 1 : NaN,

 text: Math.abs(state.sc[index]) > 1 ? "TRIGGER" : "SETUP",

 color: state.sc[index] > 1 ? parameters.colorTriggerBuy : parameters.colorSetupBuy

};
It also makes use of signal squares (markerStyle: SQUARE) and entry arrows (ARROW_UP / ARROW_DOWN), providing a complex identification, confirmation, and entry system created all in one script.
What custom studies mean for your platform
The built-in library of more than 100 indicators covers the standard toolkit. Custom studies extend it. Your development team, or a strategy vendor you commission, can build proprietary indicators with implied-volatility models, multi-timeframe data, candle coloring, filled zones, anchored callouts, and built-in alerts. These studies run inside DXcharts in the browser, next to the standard indicators your traders already use. DXcharts’ analytics integration shows how traders work with the existing indicators, which helps you decide which studies to build first.
Explore the DXcharts demo, or send your developers to the custom studies documentation to build a first study. To discuss bringing your proprietary indicators to your platform, talk to our team.