
Super Trend (ST) is a trend-following indicator that adjusts to market volatility using the Average True Range (ATR). It plots three lines: a line above price, a line below price to indicate potential trend direction, and a mid-price (HL2) line to serve as a reference for calculation. When the line is below price, the market is considered in an uptrend; when above, in a downtrend. The lines shift position when price crosses them, offering visual cues for trend continuation or reversal. ST works best in trending markets and may produce false signals during consolidation. The calculation uses the mid-price (HL2) and adds or subtracts the ATR multiplied by a user-defined factor. If the close is below the previous value, the upper boundary is used; otherwise, the lower.
where:
HL2 – the average of the high and low prices
ATR – Average True Range
Multiplier – a user-defined factor applied to ATR
Uppert – the threshold above price that signals a potential downtrend if crossed
Lowert – the threshold below price that signals a potential uptrend if crossed
St – the Super Trend value in the current period
STt-1 – the Super Trend value in the previous period
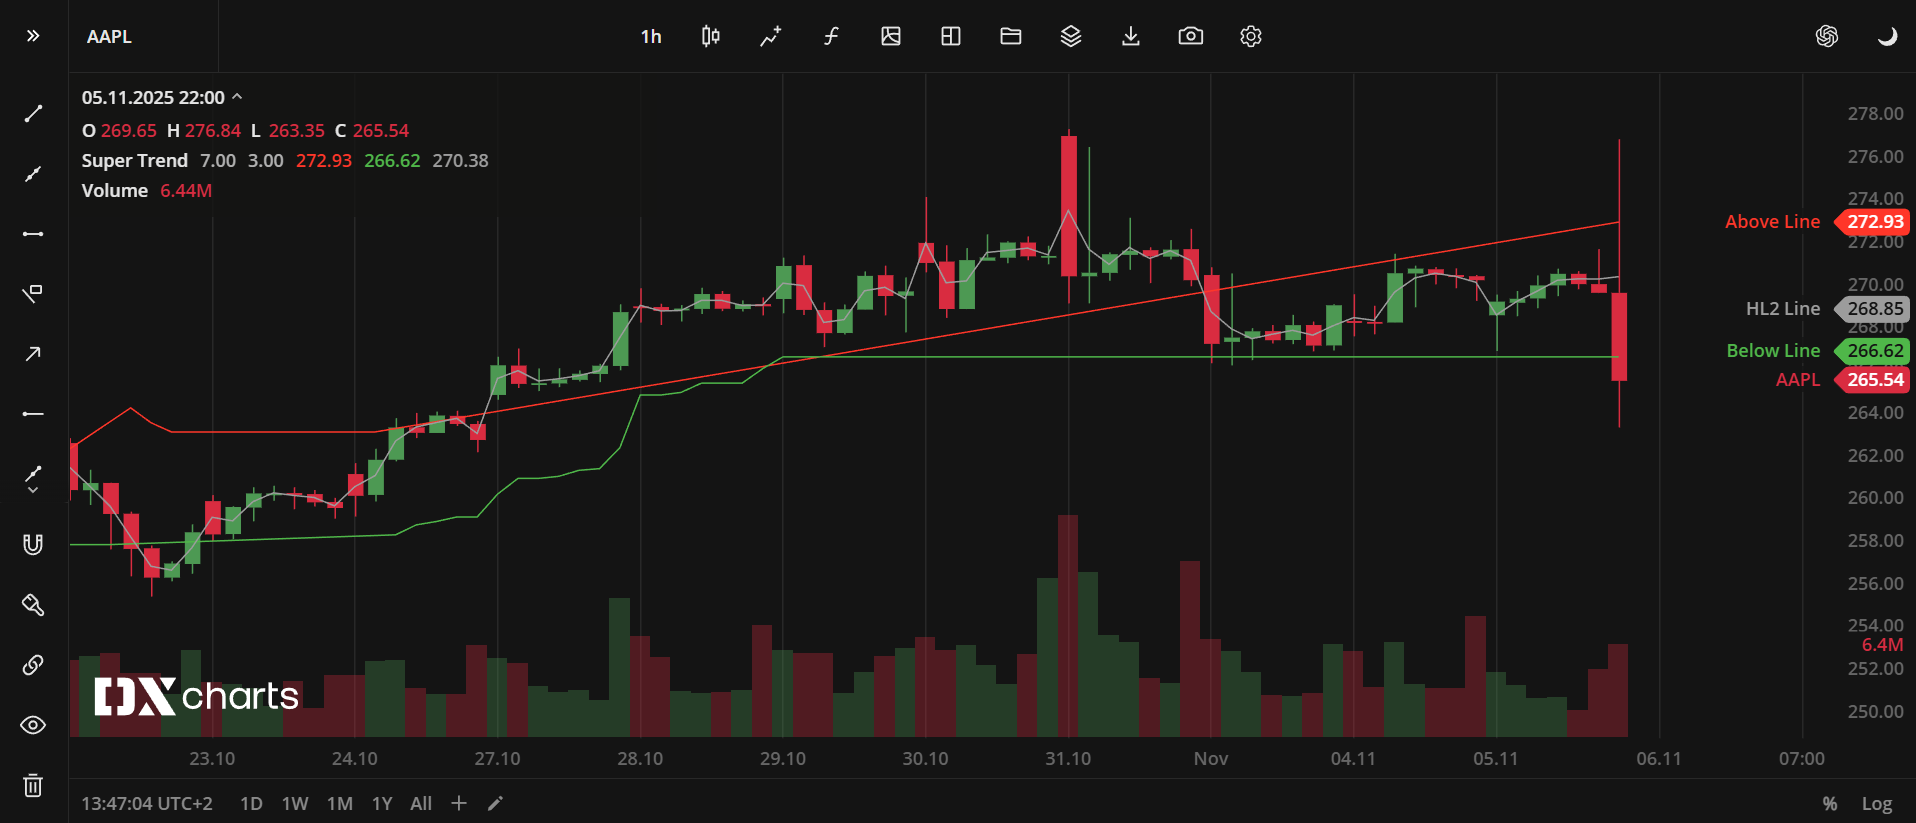
Super Trend (ST) indicator
INPUTS
Inputs | Description |
|---|---|
ATR Period | The number of price bars used to calculate ATR |
ATR Multiplier | The value that multiplies ATR to determine the distance between the indicator line and the price |
PLOTS
The plot renders the data you are working with on the chart. You can show/hide a plot by clicking the corresponding item in the settings. Every plot has a set of basic settings that you can change: color, weight, and type.
Plot | Description |
|---|---|
Above Line | The above price line |
Below Line | The below price line |
HL2 Line | The mid-price line |
Color |
|---|
Click the color rectangle under the plot's name to open the palette. Use the slider at the bottom to set the opacity of the color. 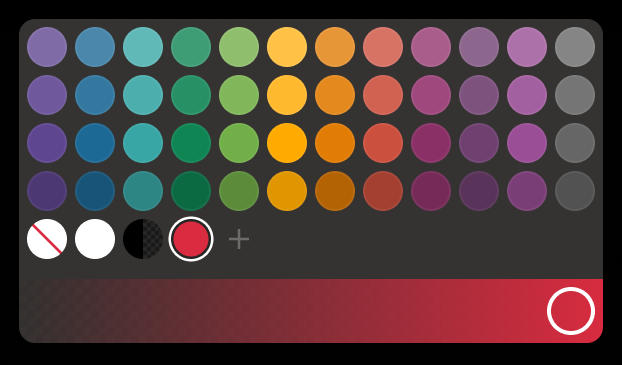 Palette To create a custom color:
The custom-created colors are added to your palette. To remove a custom color, drag it out of the palette. |
Weight |
Change the value (in px) to adjust the thickness of the plot. |
Type |
The following plot types are available:
|
 to open the color picker
OVERLAYING
Check Overlaying to display the indicator on the chart. Otherwise, the indicator is shown in a study pane down below. From the drop-down list, select the Overlaying option (Pinned to right scale, Pin to new scale on the right, Pin to new scale on the left).
Note: To reset the settings, click Restore to Default next to the SETTINGS: INDICATOR'S TITLE