
Stoller Average Range Channel Bands (STARC) is an indicator that plots two bands (support and resistance levels) above and below a security price's Simple Moving Average (SMA). Likewise Bollinger Bands (BB), STARC creates bands around a simple moving average, the only difference that BB uses standard deviations for calculation while STARC uses the Average True Range (ATR) values. The upper band (STARC+) is calculated by adding the ATR value to SMA. The lower band (STARC-) is calculated by subtracting the value of ATR from the SMA.
STARC Band+ = SMA + (Multiplier x ATR)
STARC Band- = SMA - (Multiplier x ATR)
where:
SMA – Simple Moving Average
ATR – Average True Range
Multiplier – a multiplier factor to apply to ATR
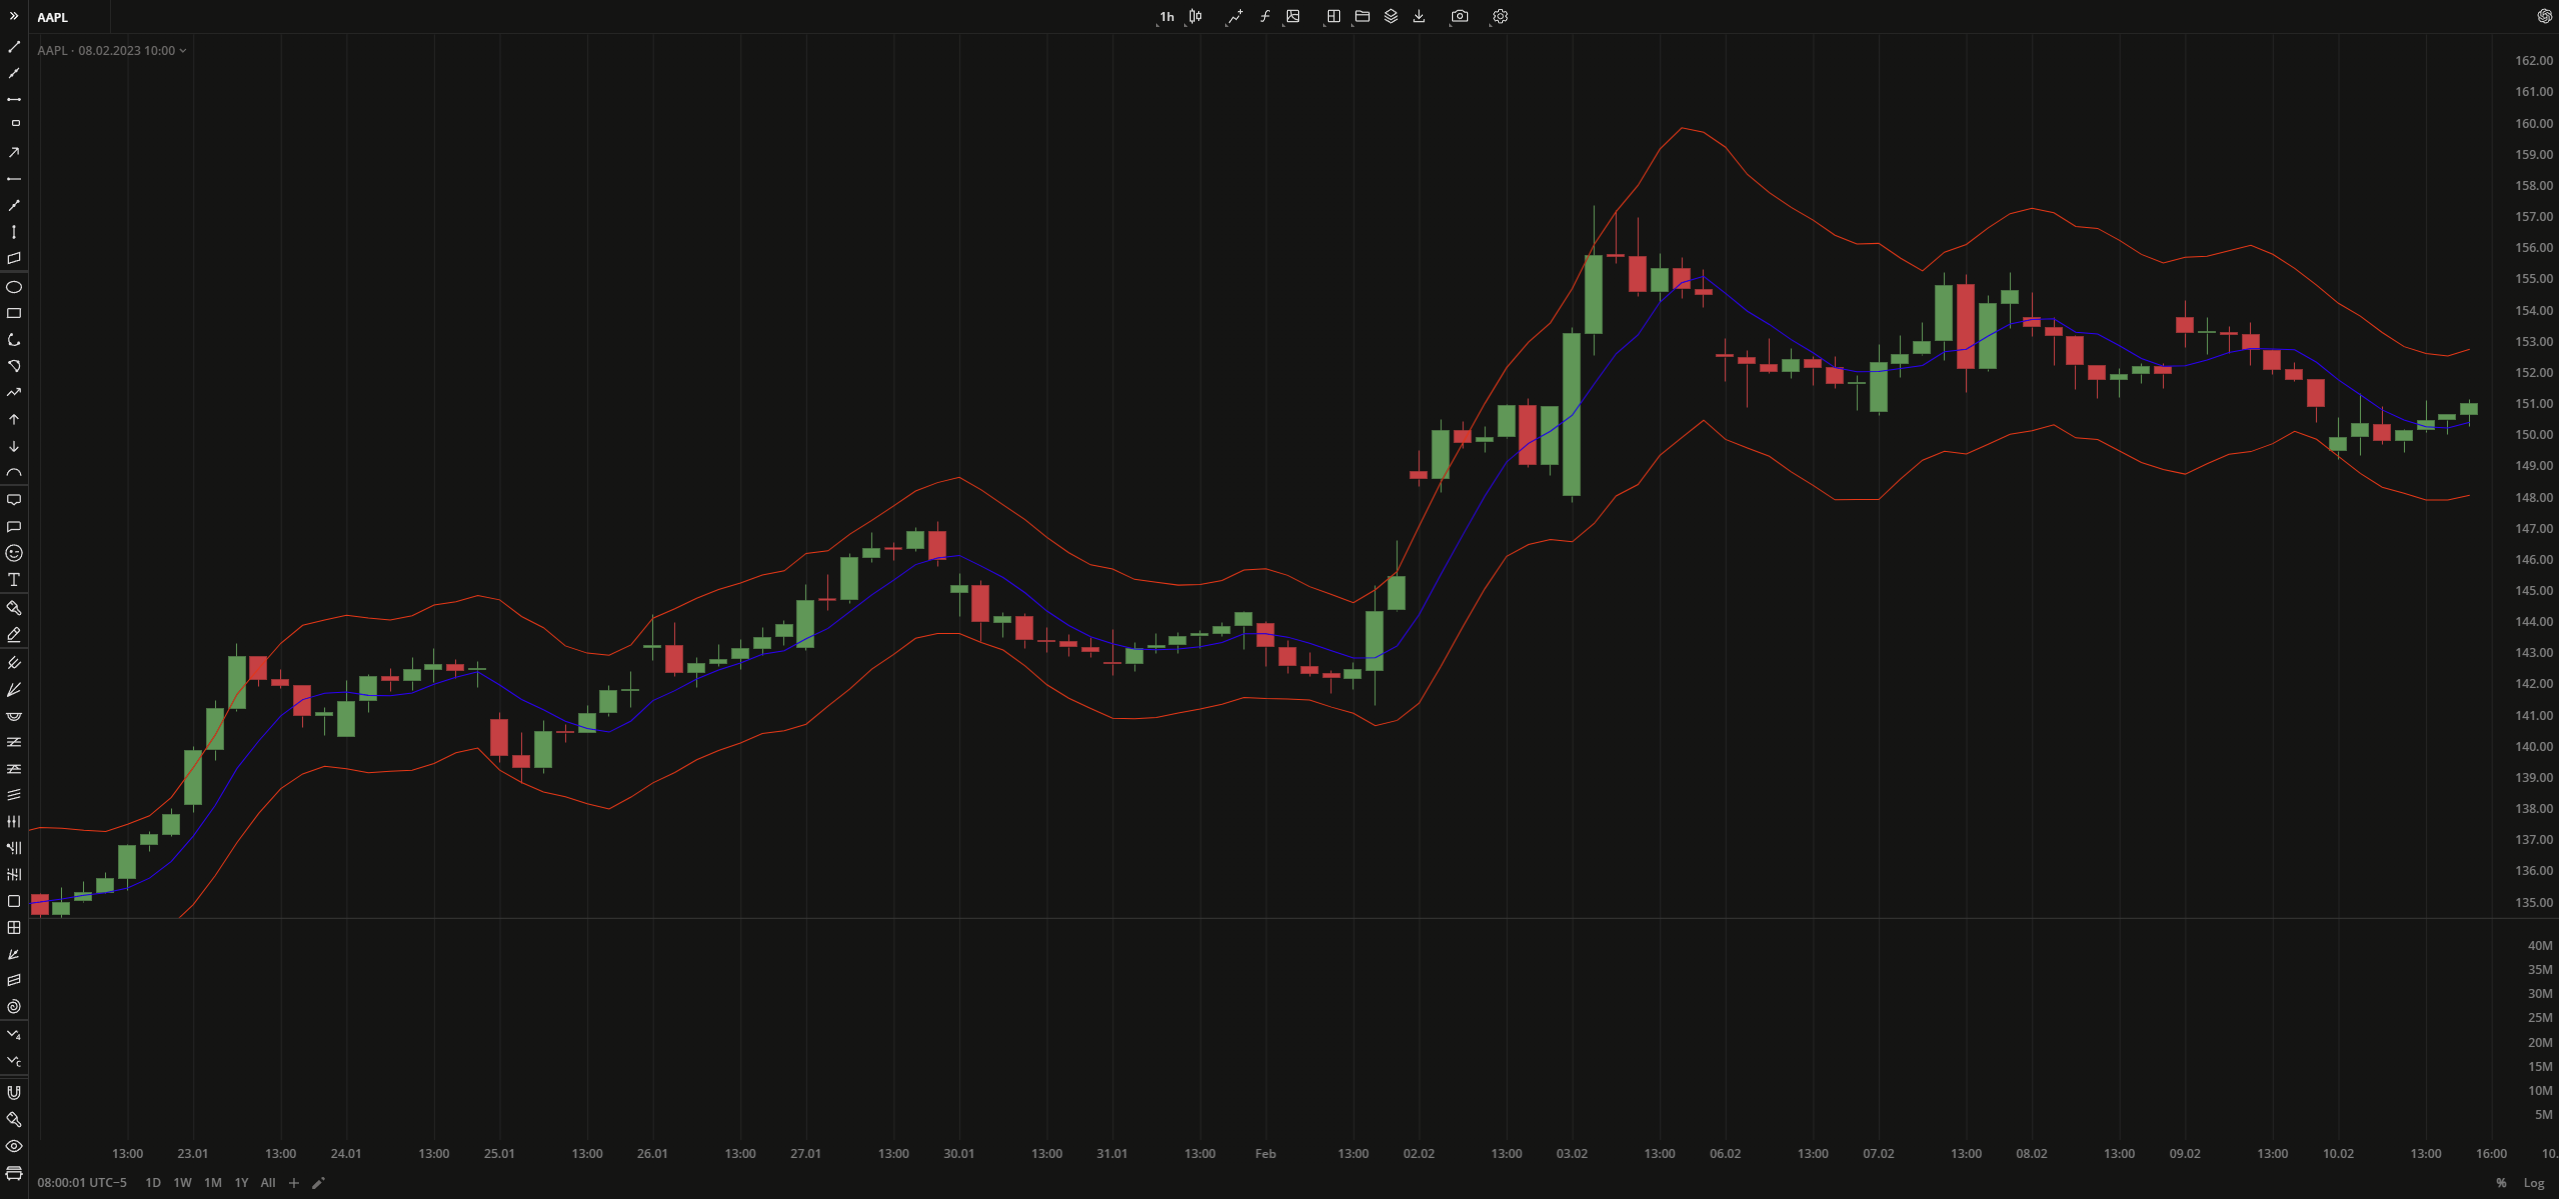 Stoller Average Range Channel Bands
INPUTS
| Price |
|---|
The following data sources are available for the price:
|
| Input | Description |
|---|---|
| AtrLength | The number of bars used to calculate ATR |
| SmaLength | The number of bars used to calculate SMA |
| Displace | The displacement of the indicator in bars |
| MultiplierFartor | The number that is applied to ATR |
PLOTS
The plot renders the data you are working with on the chart. You can show/hide a plot by clicking the corresponding item in the settings. Every plot has a set of basic settings that you can change: color, weight, and type.
| Plot | Description |
|---|---|
| LowerBand | The lower band |
| MidLine | The Simple Moving Average plot |
| UpperBand | The upper band |
| Color |
|---|
Click the color rectangle under the plot's name to open the palette. Use the slider at the bottom to set the opacity of the color. 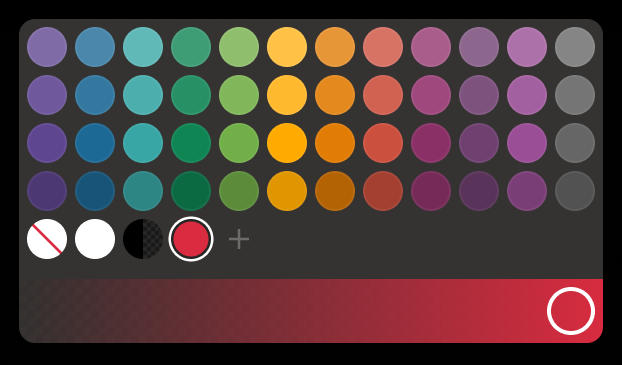 Palette To create a custom color:
The custom-created colors are added to your palette. To remove a custom color, drag it out of the palette. |
| Weight |
| Change the value (in px) to adjust the thickness of the plot. |
| Type |
The following plot types are available:
|
 to open the color picker
OVERLAYING
Check Overlaying to display the indicator on the chart. Otherwise, the indicator is shown in a study pane down below.