Trend Lines
-
DarkLight
Trend Lines
-
DarkLight
Article summary
Did you find this summary helpful?
Thank you for your feedback!

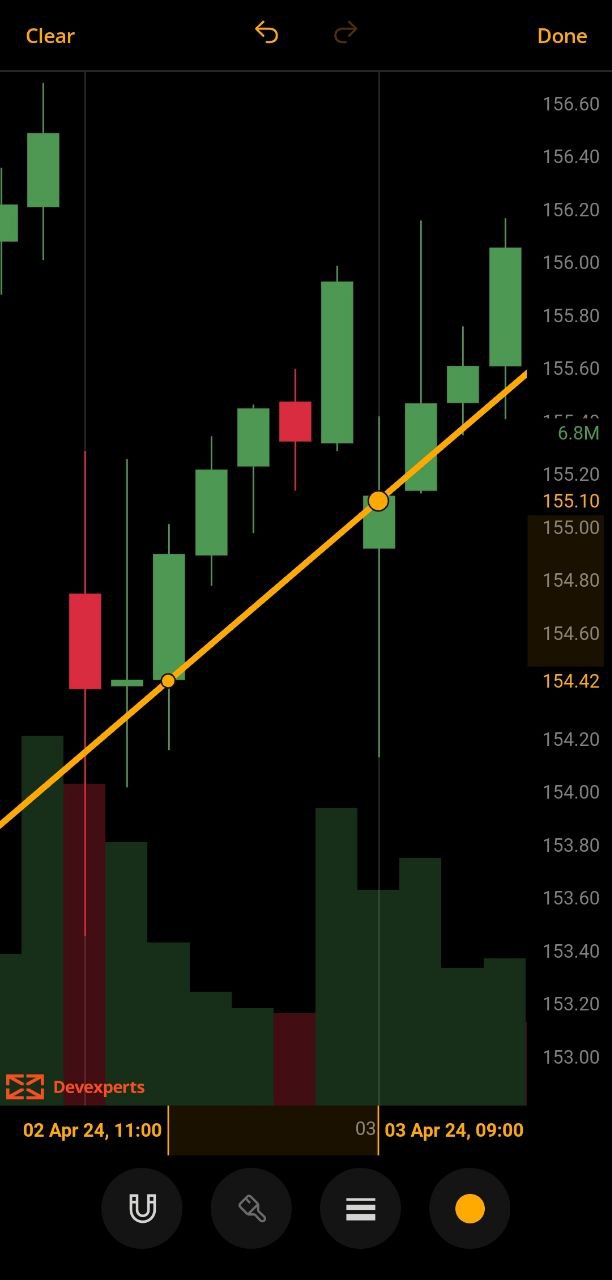
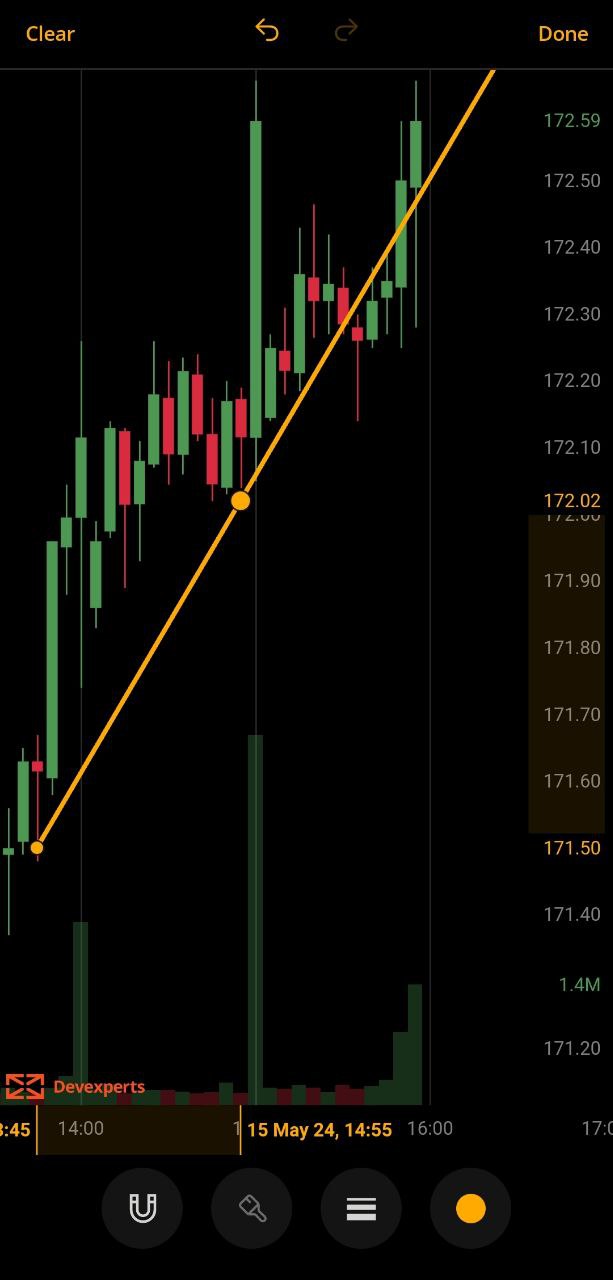
Trend Line
Trend Line is the basic drawing in the technical analysis kit. It connects two points on the chart and is used to identify sloped areas corresponding to support and resistance. If the prices stay above the trend line with a positive slope, the trend is considered bullish. If the trend line has a negative slope, the trend is considered bearish.
To add a Trend Line to the chart:
- Tap the Drawings
 icon to display the drawings from quick access.
 - Tap the Trend Line
 icon on the Drawing quick access panel.
 - Configure the parameters of the drawing, for details see Drawings.
- Specify start and end points on the chart to place the line.
- In the upper right corner of the screen, tap
 .
.
Note: To remove the selected drawing, in the left upper corner of the screen, tap Clear
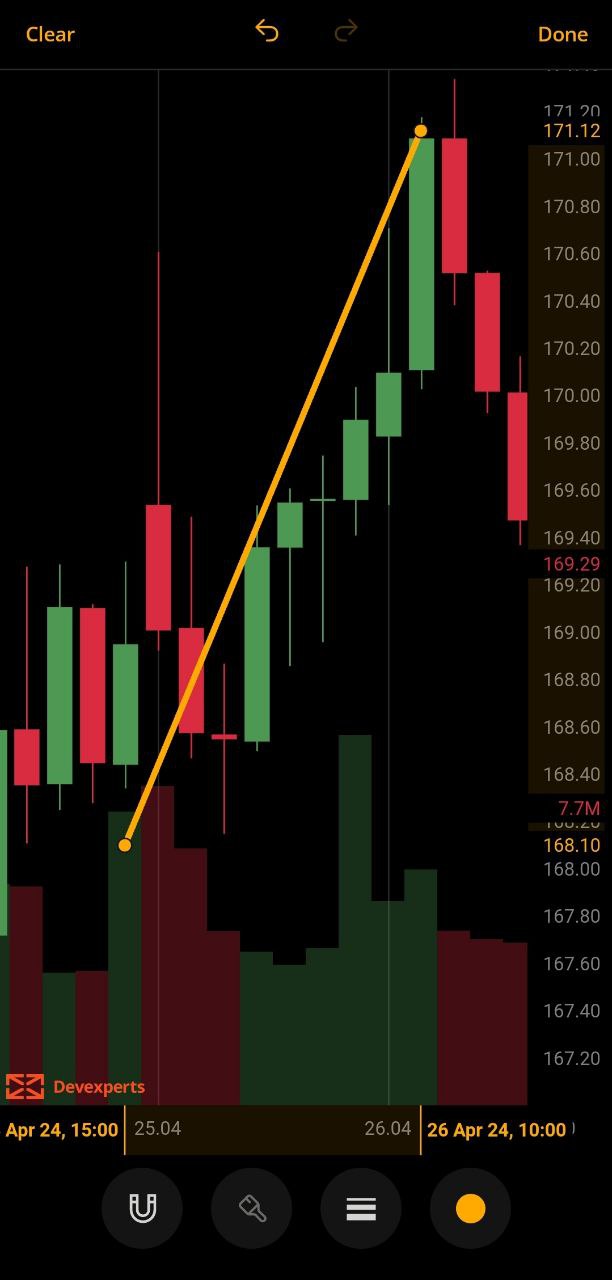 Trend Line
Note: Swipe left or right or tap Back button on your phone to go back to the previous menu
Actions with the Trend Line
- To edit the Trend Line, drag it by start or end point.
- To move the Trend Line, drag it by the line and drop it where you want it on the chart.
- You can use Undo
 and Redo
 buttons at the top of the screen.
Note: To remove all drawings at once, in the left upper corner of the screen, tap Clear all
Extended Line
Extended Line is a line that extends indefinitely in both directions on the chart. It can be then used to create your own trend line or trend channel.
The line will still be visible, extending at the same angle as its origin, even if you move far into the historical past or future on the chart.
To add an Extended Line to the chart:
- Tap the Drawingsicon to display the drawings from quick access.
- Tap the Extended Line
 icon on the Drawing quick access panel.
 - Configure the parameters of the drawing, for details see Drawings.
- Specify start and end points on the chart to place the line.
- In the upper right corner of the screen, tap.
Note: To remove the selected drawing, in the left upper corner of the screen, tap Clear
 Extended Line
Note: Swipe left or right or tap Back button on your phone to go back to the previous menu
Actions with the Extended Line
- To edit the Trend Line, drag it by start or end point.
- To move the Trend Line, drag it by the line and drop it where you want it on the chart.
- You can use Undoand Redobuttons at the top of the screen.
Note: To remove all drawings at once, in the left upper corner of the screen, tap Clear all
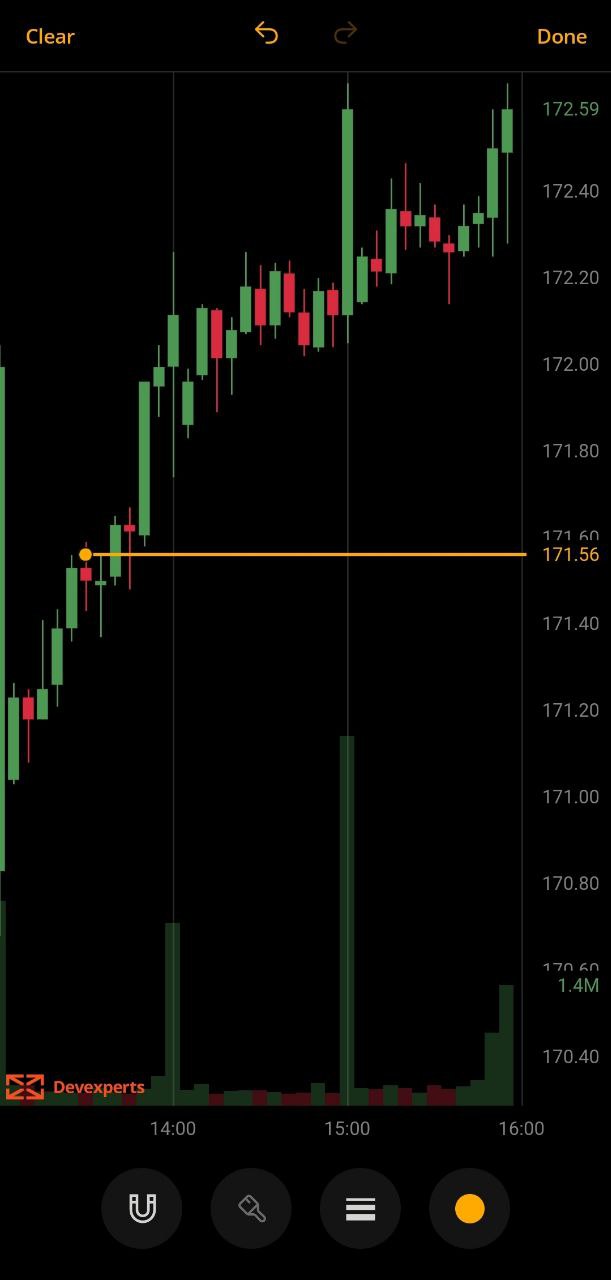
Price Line
Price Line is a horizontal line that marks a certain value on the price scale. This drawing tool is generally used to show specific price targets and identify support and resistance levels.
To add a Price Line to the chart:
- Tap the Drawingsicon to display the drawings from quick access.
- Tap the Price Line
 icon on the Drawing quick access panel.
 - Configure the parameters of the drawing, for details see Drawings.
- Tap on the screen to place the line.
- Drag the line up and down to adjust the exact price value using the price scale.
- In the upper right corner of the screen, tap.
Note: To remove the selected drawing, in the left upper corner of the screen, tap Clear
.jpg) Price Line
Price LineNote: Swipe left or right or tap Back button on your phone to go back to the previous menu
Actions with the Trend Line
- To edit the Trend Line, drag it by start or end point.
- To move the Trend Line, drag it by the line and drop it where you want it on the chart.
- You can use Undoand Redobuttons at the top of the screen.
Note: To remove all drawings at once, in the left upper corner of the screen, tap Clear all
Info Line
Info Line is a line that connects two points and displays additional information on it, such as the number of bars through which the line spans, time covered, distance in pixels, and more.
To add an Info Line to the chart:
- Tap the Drawingsicon to display the drawings from quick access.
- Tap the Info Line
.png) icon on the Drawing quick access panel.
icon on the Drawing quick access panel. - Configure the parameters of the drawing, for details see Drawings.
- Specify start and end points on the chart to place the line.
- In the upper right corner of the screen, tap.
Note: To remove the selected drawing, in the left upper corner of the screen, tap Clear
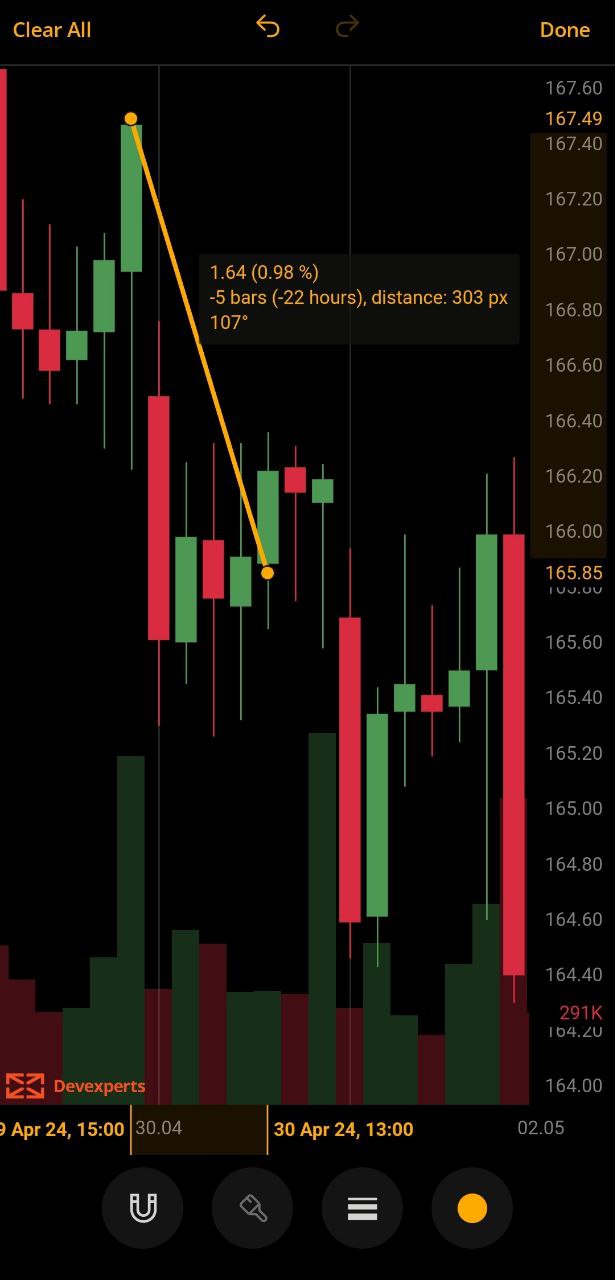 Info Line
Note: Swipe left or right or tap Back button on your phone to go back to the previous menu
Actions with the Info Line
- To edit the Info Line, drag it by start or end point.
- To move the Info Line, drag it by the line and drop it where you want it on the chart.
- You can use Undoand Redobuttons at the top of the screen.
Note: To remove all drawings at once, in the left upper corner of the screen, tap Clear all
Arrow
Arrow drawing is a line that connects two points with an arrow at its end. It is similar to the Trend Line but it also shows the direction.
To add an Arrow to the chart:
- Tap the Drawingsicon to display the drawings from quick access.
- Tap the Arrow
.png) icon on the Drawing quick access panel.
icon on the Drawing quick access panel. - Configure the parameters of the drawing, for details see Drawings.
- Specify start and end points on the chart to place the line.
- In the upper right corner of the screen, tap.
Note: To remove the selected drawing, in the left upper corner of the screen, tap Clear
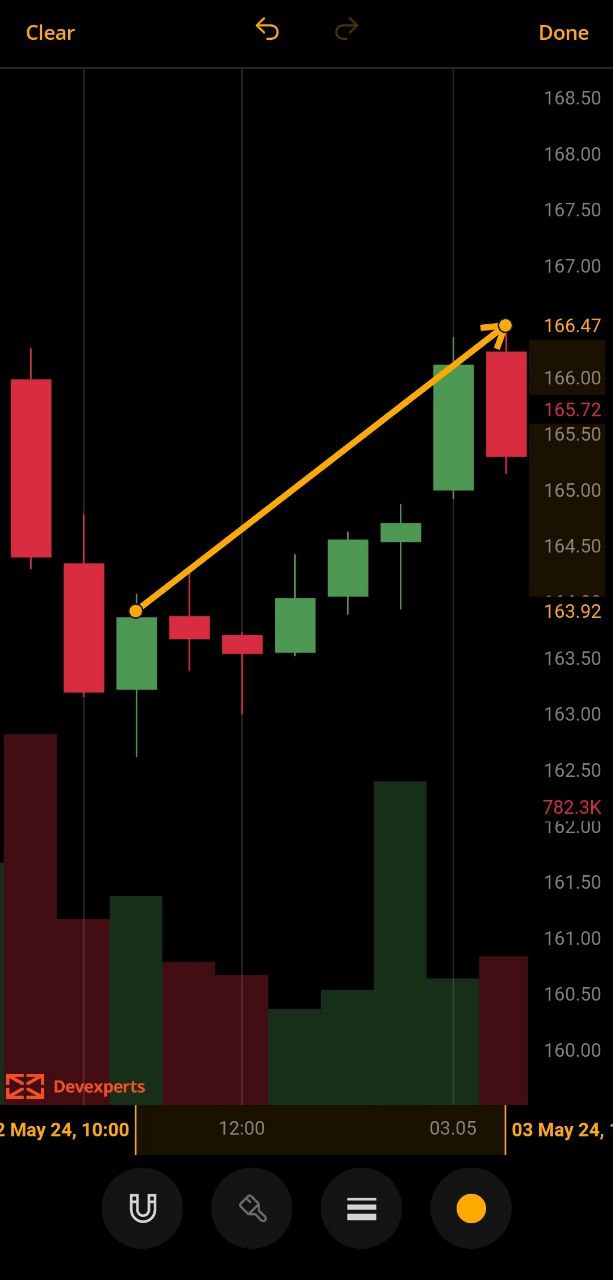 Arrow
ArrowNote: Swipe left or right or tap Back button on your phone to go back to the previous menu
Actions with the Arrow
- To edit the Arrow, drag it by start or end point.
- To move the Arrow, drag it by the line and drop it where you want it on the chart.
- You can use Undoand Redobuttons at the top of the screen.
Note: To remove all drawings at once, in the left upper corner of the screen, tap Clear all
Horizontal Ray
Horizontal Ray is a tool that draws a horizontal line that extends indefinitely to the right from from the point of its origin .
To add a Horizontal Ray to the chart:
- Tap the Drawingsicon to display the drawings from quick access.
- Tap the Horizontal Ray
(1).png) icon on the Drawing quick access panel.
icon on the Drawing quick access panel. - Configure the parameters of the drawing, for details see Drawings.
- Specify start and end poist on the chart to place the ray.
- In the upper right corner of the screen, tap.
Note: To remove the selected drawing, in the left upper corner of the screen, tap Clear
 Horizontal Ray
Note: Swipe left or right or tap Back button on your phone to go back to the previous menu
Actions with the Horizontal Ray
- To move the Horizontal Ray, drag it by the line and drop it where you want it on the chart.
- You can use Undoand Redobuttons at the top of the screen.
Ray
Ray is similar to Horizontal Ray but it allows you to draw an extended line in any direction.
To add a Ray to the chart:
- Tap the Drawingsicon to display the drawings from quick access.
- Tap the Ray
.png) icon on the Drawing quick access panel.
icon on the Drawing quick access panel. - Configure the parameters of the drawing, for details see Drawings.
- Tap on the chart to place the ray.
- In the upper right corner of the screen, tap.
Note: To remove the selected drawing, in the left upper corner of the screen, tap Clear
 Ray
RayNote: Swipe left or right or tap Back button on your phone to go back to the previous menu
Actions with the Ray
- To edit the Ray, drag it by start or end point.
- To move the Ray, drag it by the line and drop it where you want it on the chart.
- You can use Undoand Redobuttons at the top of the screen.
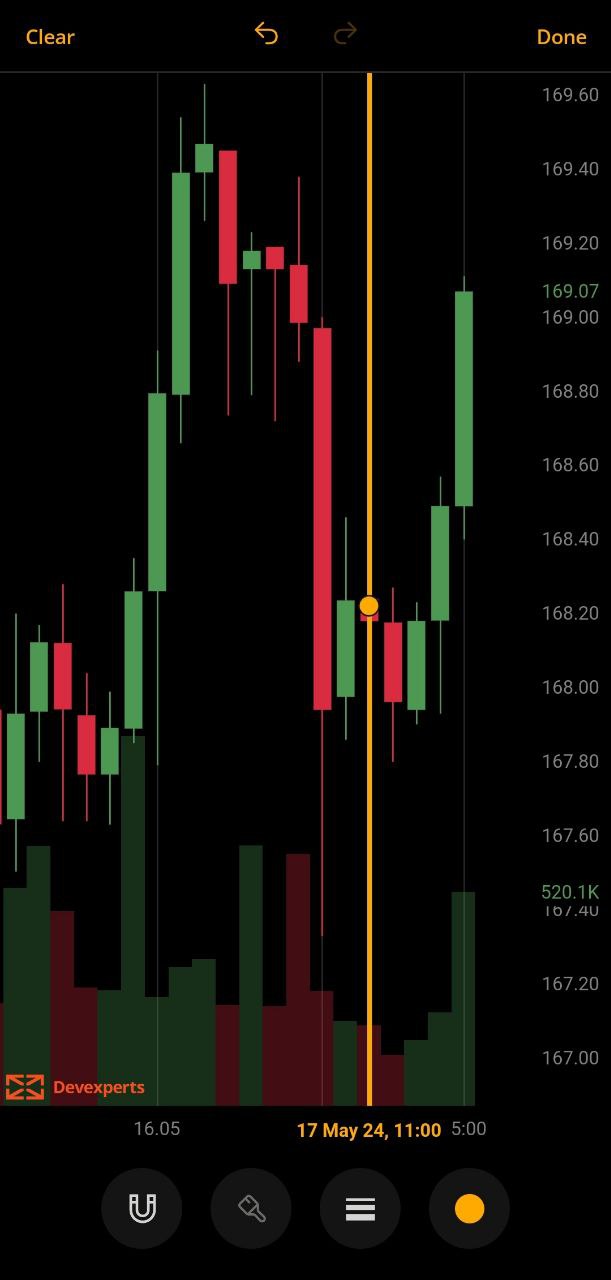
Time Line
Time Line is a vertical line that marks a specific point on the time scale.
To add a Time Line to the chart:
- Tap the Drawingsicon to display the drawings from quick access.
- Tap the Time Line
.png) icon on the Drawing quick access panel.
icon on the Drawing quick access panel. - Configure the parameters of the drawing, for details see Drawings.
- Tap on the chart to place the line.
- In the upper right corner of the screen, tap.
Note: To remove the selected drawing, in the left upper corner of the screen, tap Clear
 Time Line
Note: Swipe left or right or tap Back button on your phone to go back to the previous menu
Actions with the Time Line
- To move the Time Line, drag it by the line and drop it where you want it on the chart.
- You can use Undoand Redobuttons at the top of the screen.
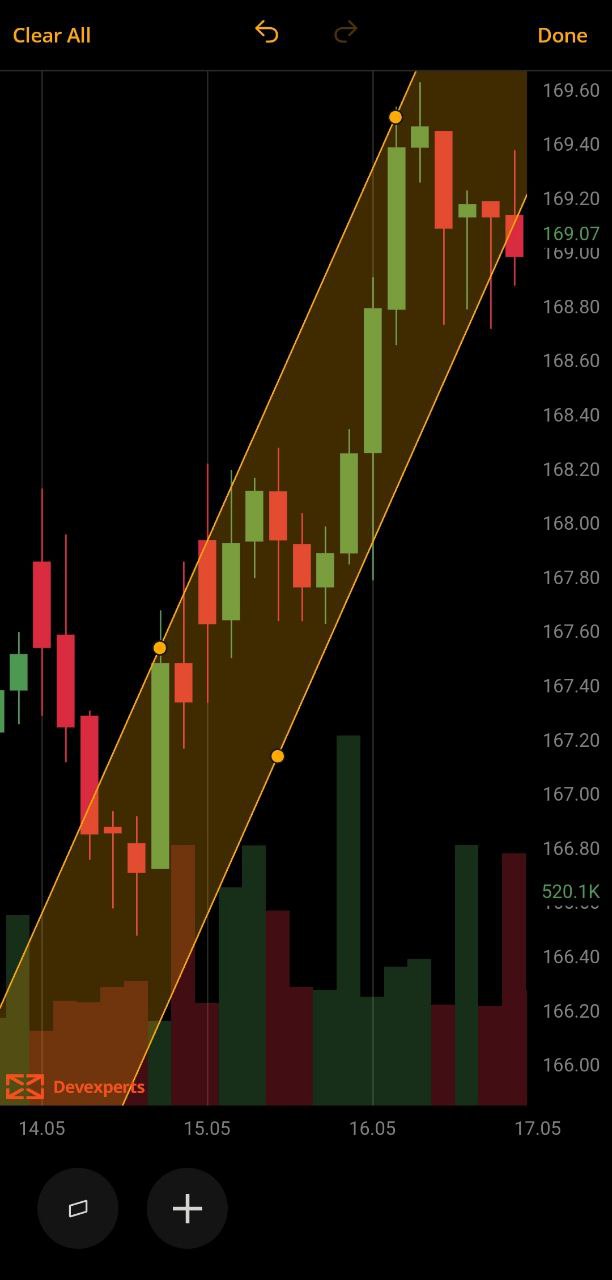
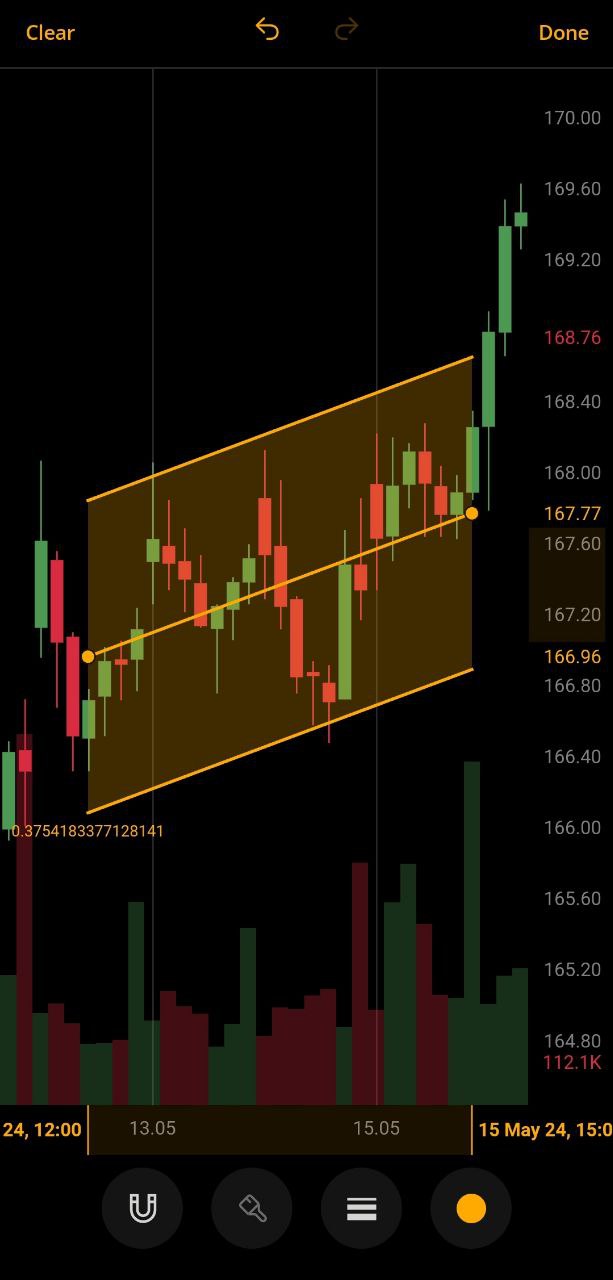
Trend Channel
Trend Channel is a tool that allows you to draw an ascending or descending area (channel) on the chart by placing two lines. The upper line marks resistance and the lower line marks support. Thus, both the top and the bottom of the channels represent potential areas of support or resistance. Trend channels with a negative slope (down) are considered bearish and thos with a positive slope (up) are considered bullish.
Trend Channel is drawn by 3 points. To add a Trend Channel to the chart:
- Tap the Drawingsicon to display the drawings from quick access.
- Tap the Trend Channel
.png) icon on the Drawing quick access panel.
icon on the Drawing quick access panel. - Configure the parameters of the drawing, for details see Drawings.
- Tap on the chart to specify start and end points on the chart to draw an upper line (ascending or descending).
- Specify the third point by tapping on the chart to set the width of the channel.
- In the upper right corner of the screen, tap.
Note: To remove the selected drawing, in the left upper corner of the screen, tap Clear
 Trend Channel
Note: Swipe left or right or tap Back button on your phone to go back to the previous menu
Actions with the Trend Channel
- To edit the Trend Channel:
- Drag it by one of two points of the upper line to change the slope of the channel.
- Drag it by the point of the lower line to change the width of the channel.
- To move the Trend Channel, drag it by upper or lower line to where you want it on the chart.
- You can use Undoand Redobuttons at the top of the screen.
Note: To remove all drawings at once, in the left upper corner of the screen, tap Clear all
Regression Trend
Regression Trend is similar to a Trend Channel. The difference is that it shows deviation levels (upper and lower) from a baseline. The main idea of this tool is to determine where the price crosses the deviation levels.
To add a Regression Trend to the chart:
- Tap the Drawingsicon to display the drawings from quick access.
- Tap the Regression Trend
 icon on the Drawing quick access panel.
 - Configure the parameters of the drawing, for details see Drawings.
- Tap on the chart to specify first point of a baseline, then specify the second point.
- In the upper right corner of the screen, tap.
Note: To remove the selected drawing, in the left upper corner of the screen, tap Clear
 Regression Trend
Note: Swipe left or right or tap Back button on your phone to go back to the previous menu
Actions with the Regression Trend
- To edit the Regression Trend, drag it by start or end points of a baseline.
- You can use Undoand Redobuttons at the top of the screen.
Note: To remove all drawings at once, in the left upper corner of the screen, tap Clear all
Was this article helpful?