DXcharts Tools: Aggregation Periods, Date and Time Presets

See all our DXcharts guides here.
Welcome to the next installment in our series on DXcharts. In our previous articles, we explored the wide range of drawing tools and chart types. Today, we will take a closer look at aggregations and date/time presets. These features play a vital role in customizing chart data and enhancing the accuracy of your analysis. Let’s jump right in and explore the flexibility that DXcharts offers in aggregation periods.
Predefined and custom aggregations
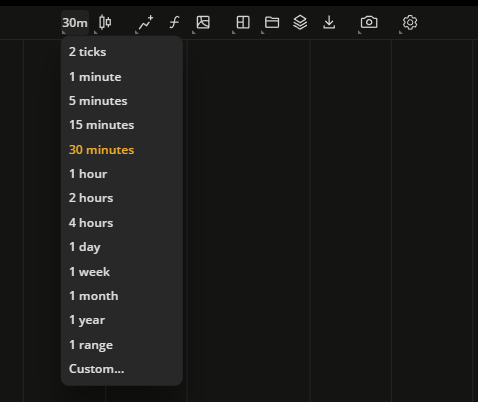
An aggregation is a time period corresponding to 1 bar displayed on the chart. In DXcharts, you can use predefined time-based aggregations consisting of standard time intervals such as ticks, minutes, hours, days, weeks, and years. Additionally, there are ranges, which are price-based aggregations. The ranges take into account only price movements, not time units, and can only be used with the “Bar” chart type.
In addition to predefined aggregations, you can set your own interval in a custom aggregation: 5 ticks, 3 minutes, 9 hours, 11 weeks, 2 years, and so on – each of these will define how much data is aggregated for a single bar.
How to create a custom aggregation period
- On the Toolbar, click the Agregation period icon that displays the current aggregation period.
- At the bottom of the aggregations list, click Custom.
- Type in a time interval for aggregation. For example: 2 ticks, 3 hours, or 4 days.
- Click the Apply icon or press Enter.
If you don’t need an aggregation, you can remove it by clicking the Remove icon next to the item.
Date and time presets
For even more flexibility, DXcharts has a tweaking tool for creating date and time presets. The tweaker allows you to set an aggregation period and then adjust a date range for which the entire chart will be plotted. Up to 15 presets can be saved as ready-to-use templates for quick access.
The following table shows all possible date ranges for the selected aggregation period:
| Aggregation | Date range |
| 5 seconds | 1 hour, 12 hours; 1 day |
| 5 minutes | 1-10, 20, 25, 30, 60, 90 days |
| 15 minutes | 1-10, 20, 25, 30, 60, 90 days |
| 30 minutes | 1-10, 20, 25, 30, 60, 90 days |
| 1 hour | 1-10, 20, 25, 30, 60, 90, 180, 285 days |
| 2 hours | 1-10, 20, 25, 30, 60, 90, 180, 285 days |
| 4 hours | 1-10, 20, 25, 30, 60, 90, 180, 285 days |
| 1 day | 1, 3, 6, 9 months; 1-10, 15, 20, 25, 30 years |
| 1 week | 3, 6, 9 months; 1-10, 15, 20, 25, 30 years |
| 1 month | 1-10, 15, 20, 25, 30 years |
How to add a date and time preset
- In the bottom left corner of the chart, click the Add icon.
- Set the aggregation period.
- Adjust the date range.
- Click Save.
To remove a preset, click the Edit icon, point to the preset, and click the Remove icon.
We hope this article has shed some light on the rich functionality of DXcharts. Predefined and custom aggregations in DXcharts are great tools to ensure a more granular approach to data analysis, thanks to the flexibility and customization they offer. You can try creating custom aggregations on your own by checking out the DXcharts demo, and it can become a good starting point for exploring other tools.