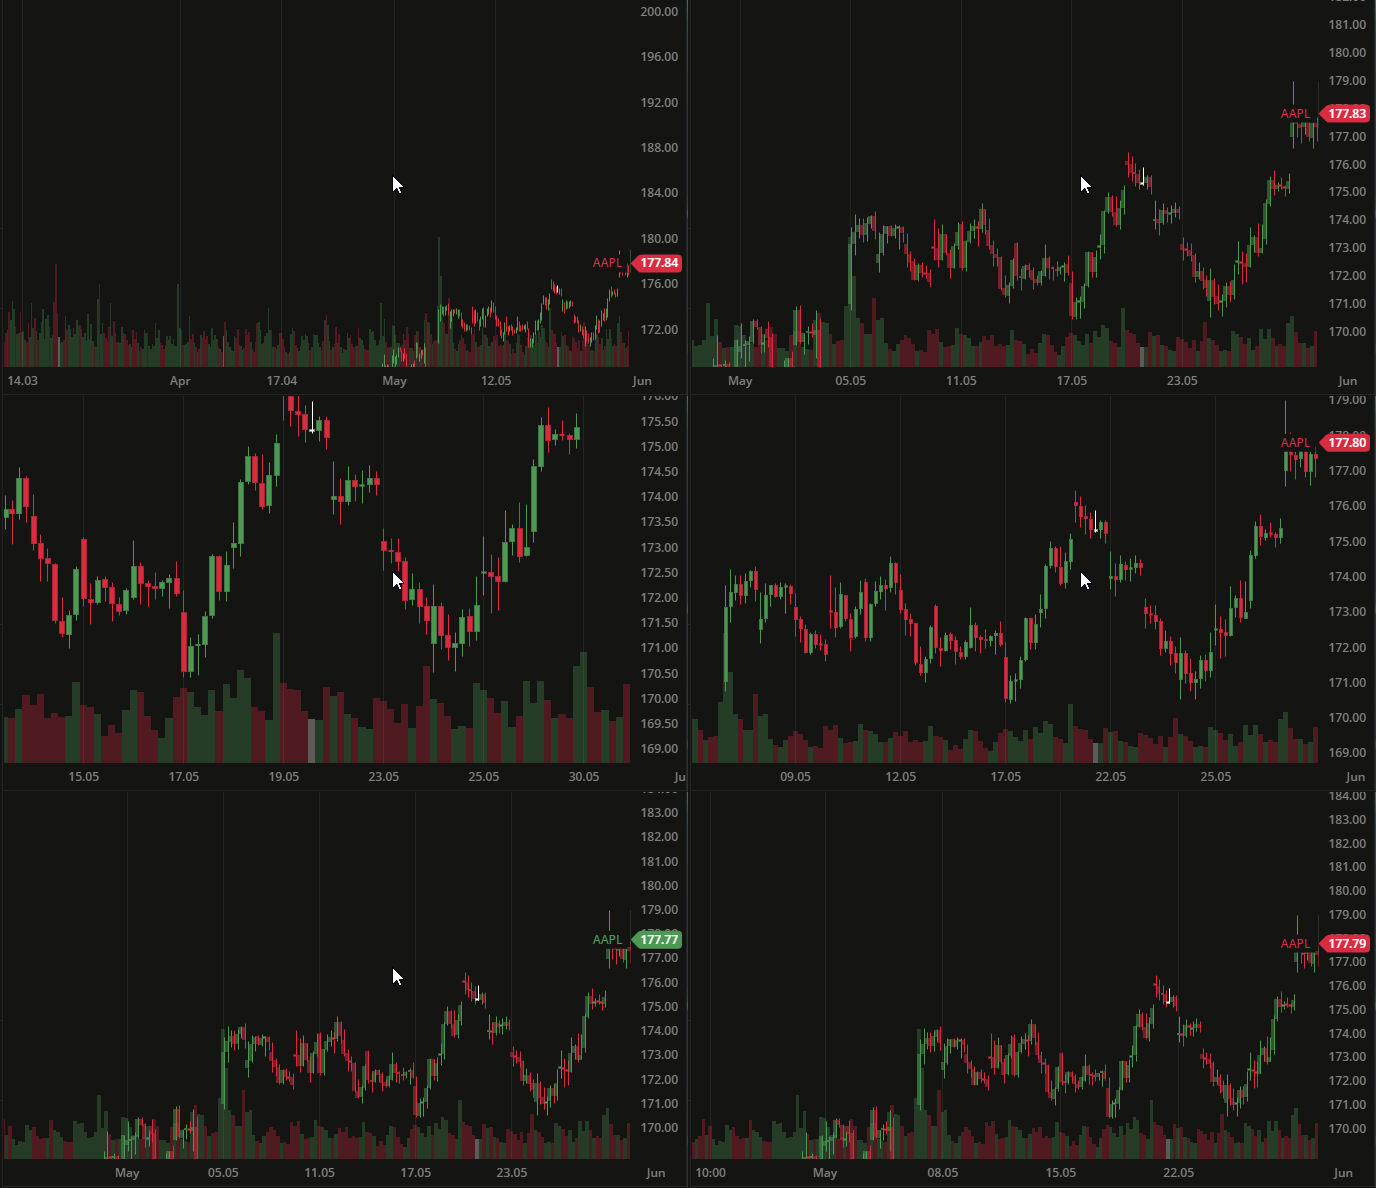
Scaling

Scaling adjusts the visible chart range along the X and Y axes.

User interactions

You can scale the chart in several ways:

  • Drag the axis: Click and drag the X or Y axis.
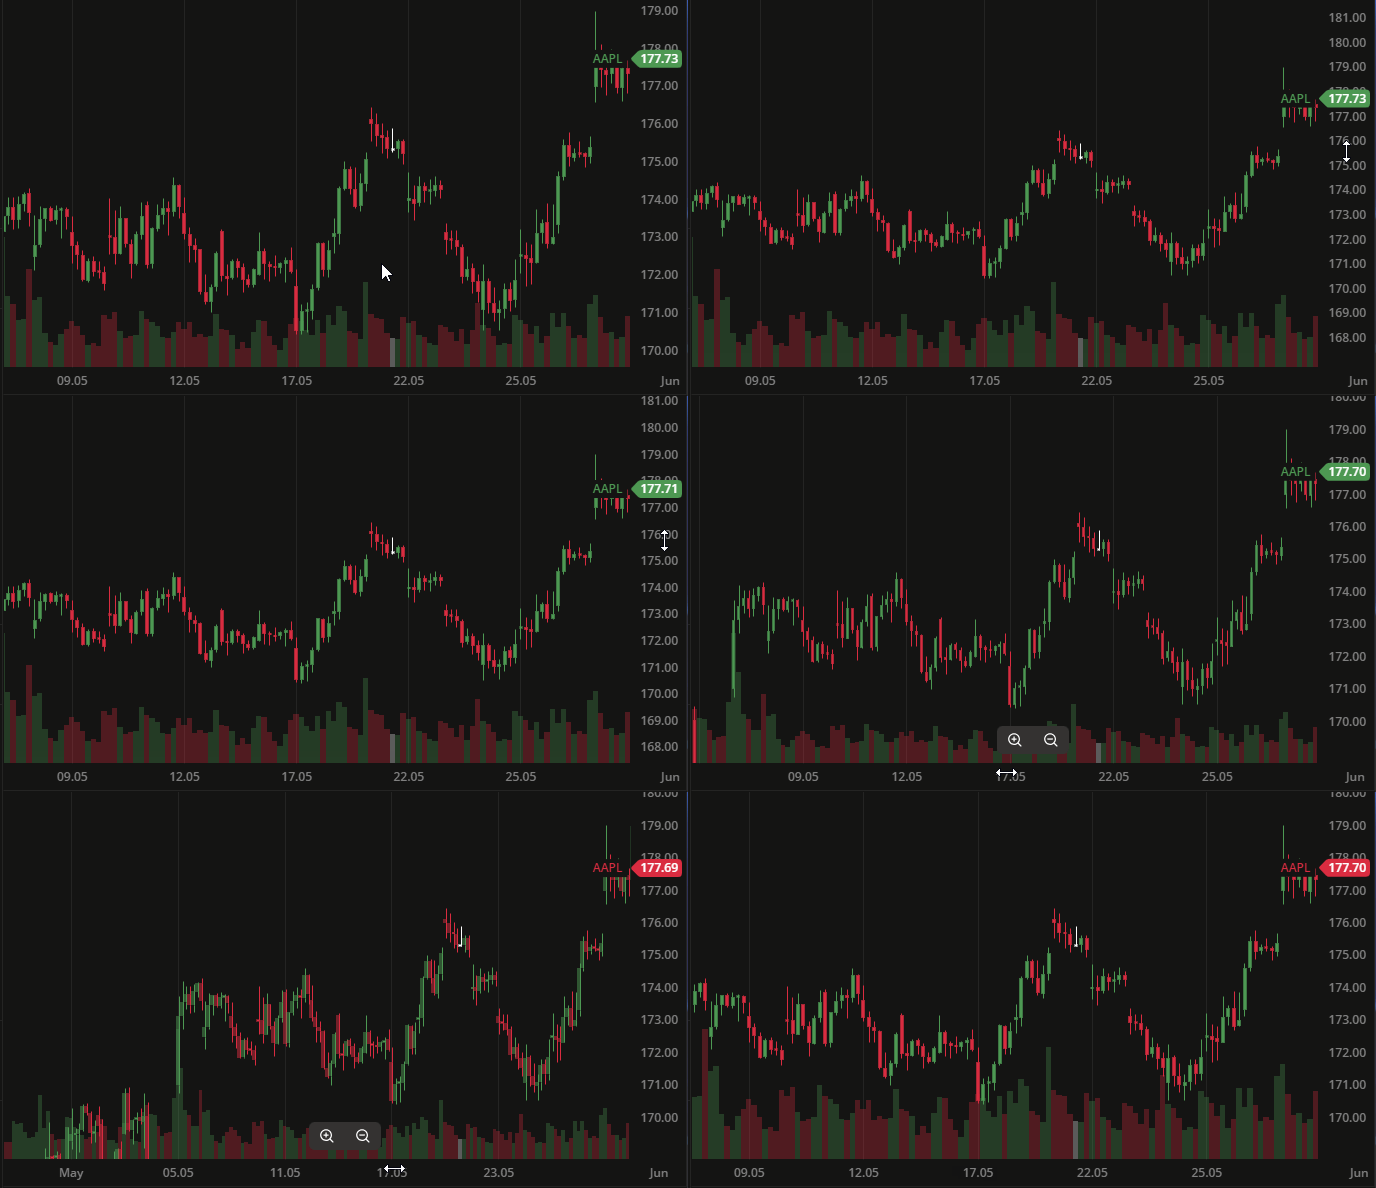
Scale by axis

  • Scroll to zoom: Use the mouse scroll wheel.
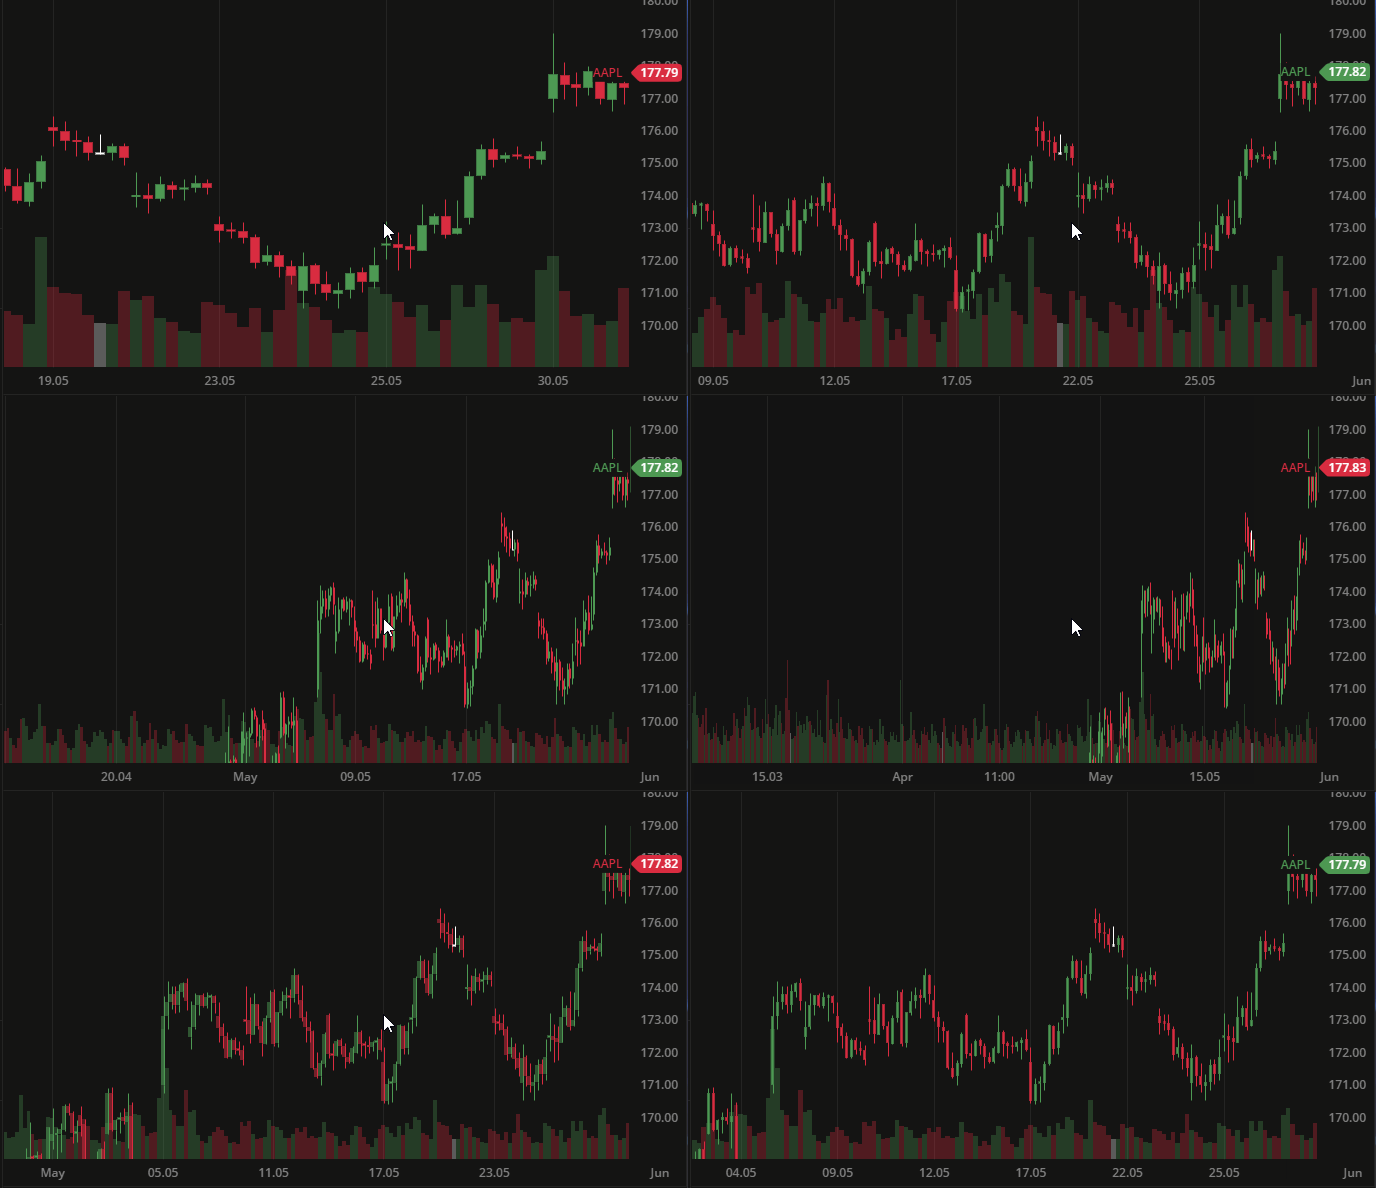
Scale by mouse scroll with X

  • Scale both axes: Enable lockPriceToBarRatio to zoom X and Y simultaneously.

Scale by by mouse scroll with X and Y

Panning

Panning shifts the chart horizontally or vertically.

Press and hold the left mouse button, then drag the chart:
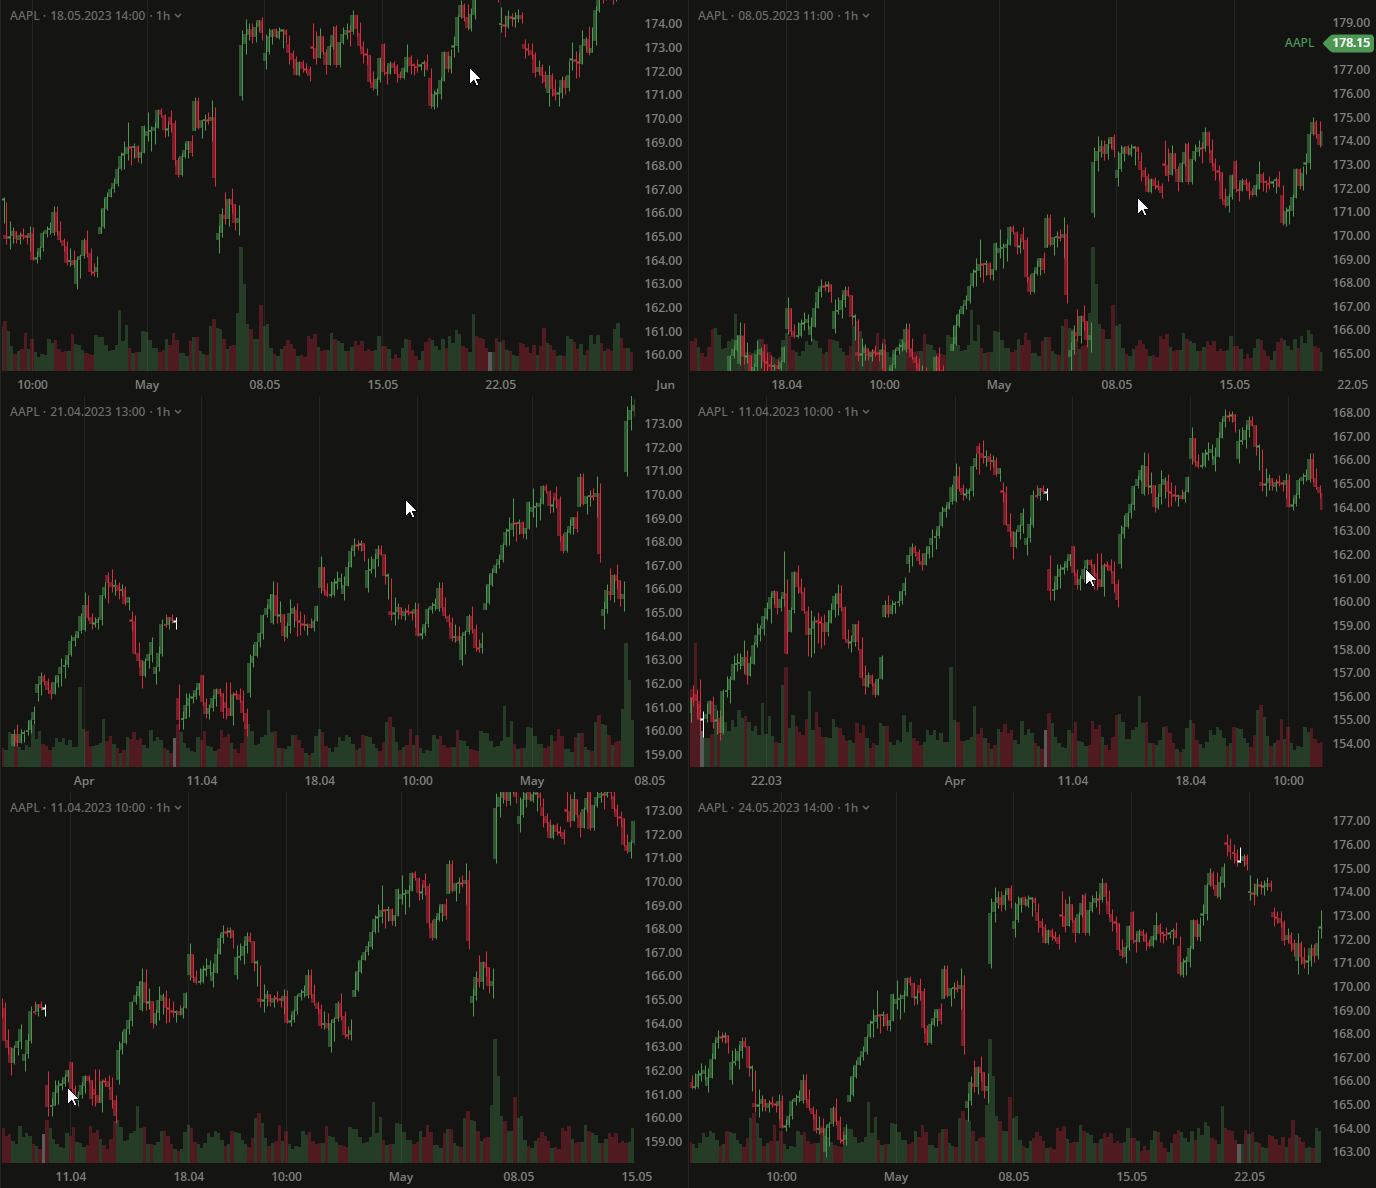
Scale by by mouse scroll with X and Y

Scale History

chart's ScaleModel has a public history property, which is used to store history of applied scales.

This store is stack-like data structure and the elements are ScaleHistoryItem's.

export interface ScaleHistoryItem {
xStart: Unit;
xEnd: Unit;
yStart: Unit;
yEnd: Unit;
}

Use the following methods from ScaleModel to access and manipulate scale history:

export class ScaleModel {
// removes from the stack the last ScaleHistoryItem
public popFromHistory(): ScaleHistoryItem | undefined {
return;
}
// pushes to the stack new ScaleHistoryItem
public pushToHistory(item: ScaleHistoryItem): void {}
// removes all the elements from the history
public clearHistory(): void {}
}

Example

export function scaleHistoryExample(scale: ScaleModel) {
const historyItem = scale.popFromHistory();
if (historyItem) {
scale.pushToHistory(historyItem);
scale.clearHistory();
}
}


Configuration options

Disable auto-scale on drag

To disable auto-scaling during long vertical drags using the AutoScaleDisableOnDrag interface:

export interface AutoScaleDisableOnDrag {
enabled: boolean;
/**
* The angle of mouse movement. Default - Math.PI / 9.
*/
edgeAngle: number;
/**
* Distance that mouse should travel vertically in px. Default - 80.
*/
yDiff: number;
}

Behavior

The ChartAreaPanHandler disables auto-scaling if all of the following conditions are true:

  1. AutoScaleDisableOnDrag.enabled === true
  2. AutoScaleDisableOnDrag.edgeAngle > α
  3. AutoScaleDisableOnDrag.yDiff > AB length
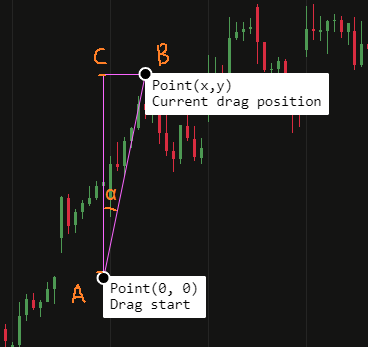
Horizontal Ray styled example

Candles viewport

You can control how many candles are displayed using the viewportStrategy option in ChartConfig.

Available strategies:

  • timeframe: Preserve the selected timeframe
  • candles: Maintain a fixed number of candles
  • basic: Use default scaling behavior

Chart scale configuration

ChartScale

Property
Description
Type
auto
Auto scale will always fit whole chart series in viewport.
boolean
zoomToCursor
True - will zoom to cursor on mouse wheel. False - zoom to last candle.
boolean
lockPriceToBarRatio
Locks the ratio between price/time, so when zooming it will feel like google maps.
boolean
inverse
Inverses the Y scale vertically.
boolean
autoScaleOnCandles
Do auto scale (even if it's not enabled in config) after instrument change.
boolean
autoScaleDisableOnDrag
When dragging chart under specific angle - will automatically disable auto-scale.
AutoScaleDisableOnDrag   +
zoomSensitivity
{ wheel: number; }
defaultViewportItems
Defines how much items (candles) will be in viewport when chart applies basic scale
number
keepZoomXOnYAxisChange
Adjust x viewport when y-axis width is changed, so x zoom remains the same
boolean
disableAnimations
Disable all scale process animations
boolean

React viewport configuration

ChartReactSettings

Property
Description
Type
legend
{ opened: boolean; showOHLC: boolean; showVolume: boolean; showInstrument: boolean; showPeriod: boolean; mode: LegendMode; }
sessionBreaks
{ visible: boolean; }
extendedHours
{ visible: boolean; }
timeframeChangeStrategy
deprecated, will be removed in v6, use viewportStrategy instead
{ aggregations: TimeframeChangeStrategy; instrument: TimeframeChangeStrategy; }
viewportStrategy
optional, to support backward compability with timeframeChangeStrategy
{ aggregations?: ViewportStrategy; instrument?: ViewportStrategy; }
trading
{ visible: boolean; showOrders: boolean; showPositions: boolean; executedOrders: { enabled: boolean; displayMode: ExecutedOrdersDisplayMode; }; bounds: { min: number; max: number; }; rightOffset: number; }
candlesData
{ price: "last" | "mark" | "bid" | "ask"; candleAlignment: "session_start" | "midnight"; }
aggregationPeriod
{ applyUponCreation: boolean; }
scale
{ fit: { studies: boolean; orders: boolean; positions: boolean; }; }