Scaling
Scaling adjusts the visible chart range along the X and Y axes.
User interactions
You can scale the chart in several ways:
- Drag the axis: Click and drag the X or Y axis.
- Scroll to zoom: Use the mouse scroll wheel.
- Scale both axes: Enable lockPriceToBarRatio to zoom X and Y simultaneously.
Panning
Panning shifts the chart horizontally or vertically.
Press and hold the left mouse button, then drag the chart:
Scale History
chart's ScaleModel has a public history property, which is used to store history of applied scales.
This store is stack-like data structure and the elements are ScaleHistoryItem's.
export interface ScaleHistoryItem {xStart: Unit;xEnd: Unit;yStart: Unit;yEnd: Unit;}
Use the following methods from ScaleModel to access and manipulate scale history:
export class ScaleModel {// removes from the stack the last ScaleHistoryItempublic popFromHistory(): ScaleHistoryItem | undefined {return;}// pushes to the stack new ScaleHistoryItempublic pushToHistory(item: ScaleHistoryItem): void {}// removes all the elements from the historypublic clearHistory(): void {}}
Example
export function scaleHistoryExample(scale: ScaleModel) {const historyItem = scale.popFromHistory();if (historyItem) {scale.pushToHistory(historyItem);scale.clearHistory();}}
Configuration options
Disable auto-scale on drag
To disable auto-scaling during long vertical drags using the AutoScaleDisableOnDrag interface:
export interface AutoScaleDisableOnDrag {enabled: boolean;/*** The angle of mouse movement. Default - Math.PI / 9.*/edgeAngle: number;/*** Distance that mouse should travel vertically in px. Default - 80.*/yDiff: number;}
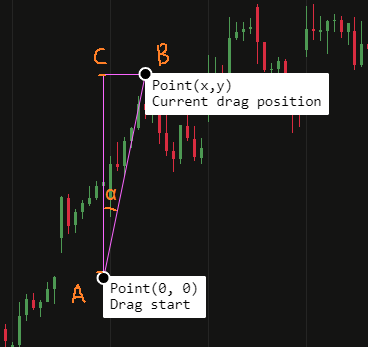
Behavior
The ChartAreaPanHandler disables auto-scaling if all of the following conditions are true:
AutoScaleDisableOnDrag.enabled === trueAutoScaleDisableOnDrag.edgeAngle > αAutoScaleDisableOnDrag.yDiff > AB length
Candles viewport
You can control how many candles are displayed using the viewportStrategy option in ChartConfig.
Available strategies:
timeframe: Preserve the selected timeframecandles: Maintain a fixed number of candlesbasic: Use default scaling behavior
API axis range
To set a fixed Y or X range instead of auto-scaling:
- Disable auto-scale in
initialChartConfig(React) or chart config (lite). Also setautoScaleOnCandles: false— otherwise the chart re-enables auto-scale when candles are loaded:
initialChartConfig: {
	scale: { auto: false, autoScaleOnCandles: false },
}
- After candles are loaded, set the range programmatically on the chart instance (
chartfromcreateChart/ chart API):
- Y-axis (price units):
chart.scale.setYScale(yStart, yEnd) - X-axis (candle index units):
chart.data.setXScale(xStart, xEnd) - X-axis (timestamps):
chart.data.setTimestampRange(startTimestamp, endTimestamp)
Subscribe to chart.data.observeCandlesChanged() so the scale is applied after the initial candle data is set. If scale.auto is still true, setYScale / setXScale will run auto-scaling again and override your values.
Scroll limits
Panning past the first or last candle is constrained by components.chart.minCandlesOffset (default 2).
initialChartConfig: {
  components: {
    chart: { minCandlesOffset: 5 }, // stricter edge — less empty space beyond candles
  },
},
For custom rules, add your own constraint in onChartCreated:
chart.scale.addXConstraint((initialState, state) => {
  // return modified state — see candleEdgesConstrait in chart-core for reference
  return state;
});
Set scale.disableAnimations: true to turn off viewport pan/zoom animation (including when the last candle updates).
Chart scale configuration
ChartScale
auto
zoomToCursor
lockPriceToBarRatio
inverse
autoScaleOnCandles
autoScaleDisableOnDrag
zoomSensitivity
defaultViewportItems
keepZoomXOnYAxisChange
disableAnimations
React viewport configuration
ChartReactSettings
legend
sessionBreaks
extendedHours
timeframeChangeStrategy
viewportStrategy
trading
candlesData
aggregationPeriod
scale