Candlestick signals and patterns are among the most widely used tools in technical analysis, offering traders a visual way to understand market sentiment and anticipate potential price movements. Each candlestick represents a specific period of trading activity and reflects the ongoing “battle” between buyers (bulls) and sellers (bears). By learning to recognize recurring candle shapes and patterns, traders can identify moments when trends may reverse, continue, or pause.
Single candlestick patterns
Single candlestick patterns are the simplest signals and can quickly highlight shifts in market sentiment. One of the most well-known is the doji, where the opening and closing prices are nearly identical. This creates a small or nonexistent body and reflects indecision—neither buyers nor sellers are clearly in control. Depending on its shape, a doji can hint at a potential reversal, especially when it appears after a strong trend. Another key pattern is the hammer, which forms after a downtrend and features a small body with a long lower wick. It suggests that sellers pushed prices down, but buyers stepped in and drove them back up, signaling a possible bullish reversal. Its counterpart, the hanging man, appears in an uptrend with a similar shape but warns of potential weakness and a bearish reversal.
Multi-candlestick patterns
While single candles provide useful signals, multi-candlestick patterns tend to be more reliable because they capture shifts in momentum over multiple periods. One of the most important is the engulfing pattern, in which a larger candle completely “engulfs” the body of the previous candle. A bullish engulfing pattern occurs when a strong upward candle follows a smaller downward one, indicating that buyers have taken control. Conversely, a bearish engulfing pattern suggests that sellers are overpowering buyers. These patterns are particularly significant when they occur near key levels such as support or resistance.
Three-candle patterns offer even deeper insights into market dynamics. The morning star is a classic bullish reversal pattern that appears after a downtrend. It consists of a strong bearish candle, followed by a small indecisive candle, and then a strong bullish candle that confirms a shift in control. The evening star works in the opposite direction, signaling a bearish reversal after an uptrend. Other formations, such as three white soldiers (a series of strong bullish candles) and three black crows (a series of strong bearish candles), indicate sustained momentum and are often used to confirm trend continuation.
Understanding candlestick patterns is about interpreting the underlying supply-and-demand story. For example, a long upper wick shows that buyers pushed prices higher but were eventually overpowered by sellers, while a long lower wick suggests that sellers lost control to buyers. When these signals appear repeatedly or in combination with other patterns, they can provide valuable clues about market direction.
However, candlestick patterns are most effective when used in context. Relying on them alone can lead to false signals, especially in volatile or low-volume markets. Traders often combine candlestick analysis with other tools, such as moving averages, the relative strength index (RSI), and volume analysis, to confirm signals. For instance, a bullish pattern near a strong support level, accompanied by high trading volume, is generally more reliable than the same pattern appearing in isolation.
It is also important to avoid common mistakes. One of the biggest pitfalls is ignoring the broader trend—taking a bullish signal in a strong downtrend without confirmation can lead to losses. Another is focusing on very short timeframes, where patterns may reflect random noise rather than meaningful market behavior. Volume is another critical factor: without sufficient participation, even well-formed patterns may fail to produce the expected outcome.
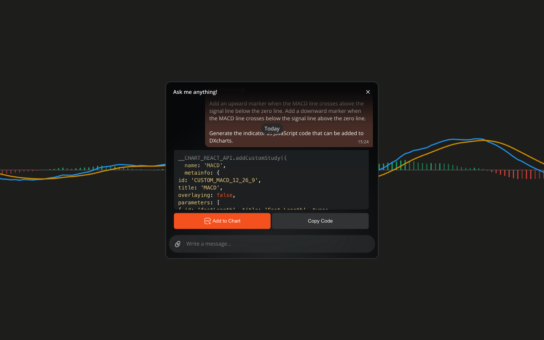
In modern trading, many platforms offer tools that automatically detect candlestick patterns, helping traders identify opportunities more quickly. While these tools can be helpful, they should be used as aids rather than replacements for understanding the logic behind each pattern.
In summary, candlestick signals and patterns provide a powerful way to read market sentiment and anticipate price movements. By combining knowledge of candle anatomy, recognizing key patterns, and applying them within the broader market context, traders can make more informed and confident decisions.