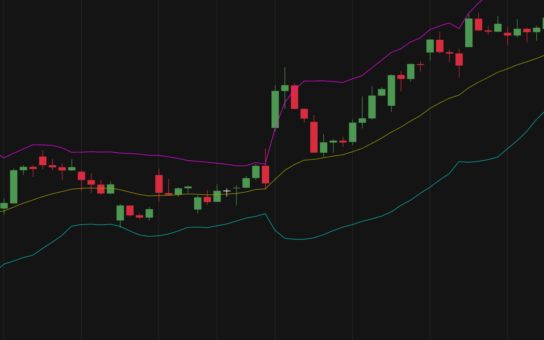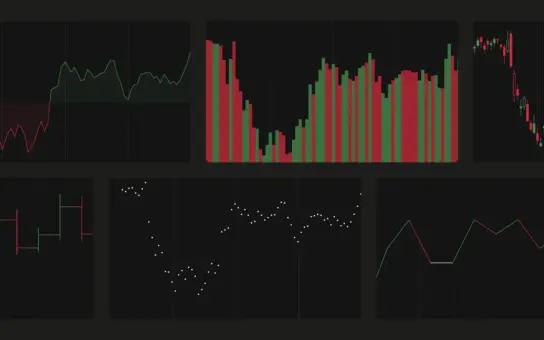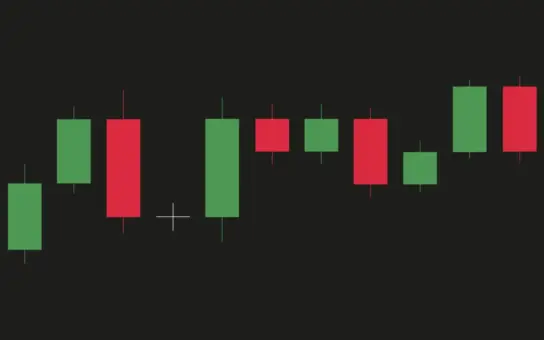
Japanese candlesticks have become the standard chart type for traders worldwide. They provide detailed information about price movement, showing the Open, High, Low, and Close for each period while revealing market sentiment through recognizable candlestick patterns.
But detailed information is not always the same as useful information.
Modern markets are increasingly shaped by algorithmic trading and rapid order execution, which together drive short-term volatility. As a result, charts can sometimes become noisy, with frequent price spikes and temporary reversals making it difficult to identify the broader trend.
This is why many traders use alternative chart types alongside traditional candlesticks. Rather than replacing price action analysis, these charts can reveal information hidden beneath day-to-day market fluctuations.
When candlesticks become too noisy
Standard candlesticks display every price movement over a given period. This makes them excellent for identifying precise entry points, exit points, support and resistance levels, and candlestick patterns.
However, that level of detail can sometimes work against you.
Imagine a market that is steadily trending upward but experiences several sharp intraday pullbacks. Traditional candlesticks will show every one of those fluctuations, which may create the impression that the trend is weakening even when the overall direction remains intact.
In situations like these, traders often benefit from viewing prices through a different lens.
Understanding Heikin-Ashi charts
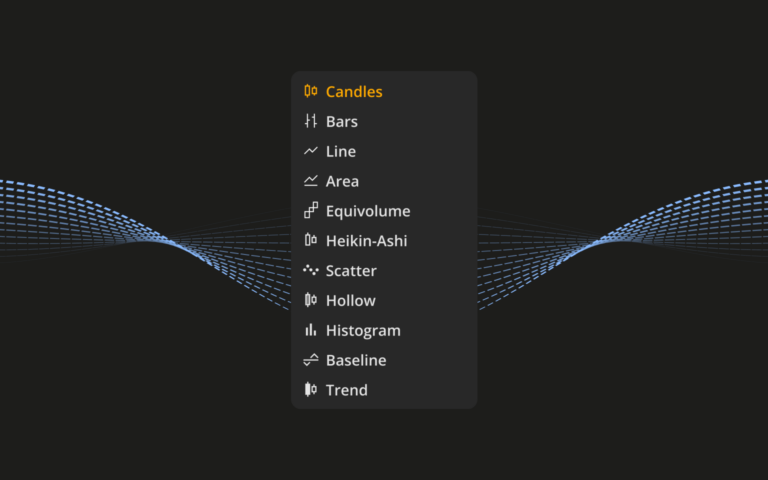
One of the most popular alternatives is the Heikin-Ashi chart, which you can try out right now in DXcharts.
Unlike traditional candlesticks, Heikin-Ashi candles use modified calculations that incorporate information from previous candles. The result is a smoother visual representation of price movement.
Rather than displaying every short-term fluctuation, Heikin-Ashi focuses on the underlying trend.
Strong uptrends often appear as a sequence of consecutive bullish candles with small or nonexistent lower shadows. Strong downtrends frequently produce a series of bearish candles with limited upper shadows.
This smoothing effect makes trends easier to identify and follow.
Seeing the trend at a glance
The main draw of Heikin-Ashi charts is how easily they show trend direction.
On a traditional candlestick chart, a trending market may contain numerous alternating bullish and bearish candles. Traders can easily become distracted by temporary pullbacks and prematurely question the trend.
On a Heikin-Ashi chart, many of these minor fluctuations are filtered out. Trend direction often becomes immediately apparent, helping traders stay focused on the bigger picture.
This can be particularly useful for swing traders and trend followers who are more concerned with the overall market direction than with every short-term price movement.
Understanding the trade-off
The smoothing that makes Heikin-Ashi useful also introduces a limitation.
Because Heikin-Ashi candles are calculated differently from market prices, the open and close values shown on the chart do not represent exact traded prices.
As a result, traders often use Heikin-Ashi for analysis and trend identification while relying on standard candlesticks for precise trade execution.
Think of Heikin-Ashi as a navigation tool rather than a measurement tool. It helps you understand where the market is moving, even if it sacrifices some detail along the way.
Use the right chart for the right task
There is no universally “best” chart type.
Traditional candlesticks excel at showing detailed price action and market structure. Heikin-Ashi charts excel at highlighting trends and reducing visual noise.
Many experienced traders switch between both views depending on the question they are trying to answer.
If you need precision, candlesticks may be the better choice. If you want a sharper read on trend direction and market momentum, Heikin-Ashi gives you a cleaner view.
Chart types are different ways of viewing the same market, not competing alternatives. Choosing the right one for the question makes complex price action easier to read and keeps your focus on what matters most.