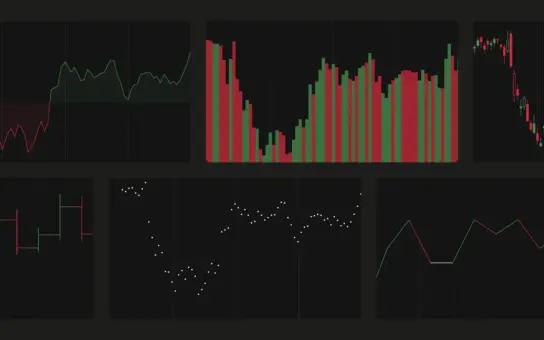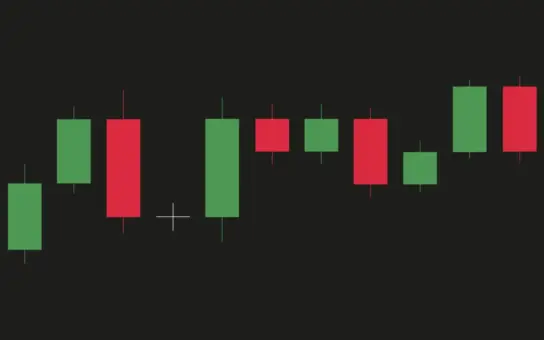
Technical indicators help traders measure momentum and volatility while confirming a trend’s direction. However, adding too many studies to a chart often creates the opposite effect: important market information becomes difficult to see beneath a layer of lines, bands, oscillators, and shaded fills.
Good chart analysis comes from choosing the right indicators and presenting them in a way that complements price action rather than obscuring it.
Avoid the “spaghetti chart”
Many traders have experienced the temptation to add indicator after indicator in search of certainty. A chart that combines multiple moving averages, Bollinger Bands, oscillators, channels, and support levels may seem sophisticated, but it can become visually overwhelming.
When every indicator is competing for attention, it becomes harder to identify what matters most: price itself.
The first step toward a cleaner workspace is establishing visual hierarchy. Price should always remain the primary focus. Indicators should provide context, not dominate the screen.
Use indicators as supporting evidence
A useful approach is to combine just two complementary types of indicators:
- A volatility indicator, such as Bollinger Bands.
- A momentum indicator, such as the Relative Strength Index (RSI).
Together, they answer two different questions.
Bollinger Bands help you understand how volatile the market is and whether the price is trading near the upper or lower boundary of its recent range.
RSI helps you evaluate momentum by showing whether buying or selling pressure may be becoming exhausted.
Because the two indicators serve different purposes, they work together without overlapping.
Clean up your Bollinger Bands
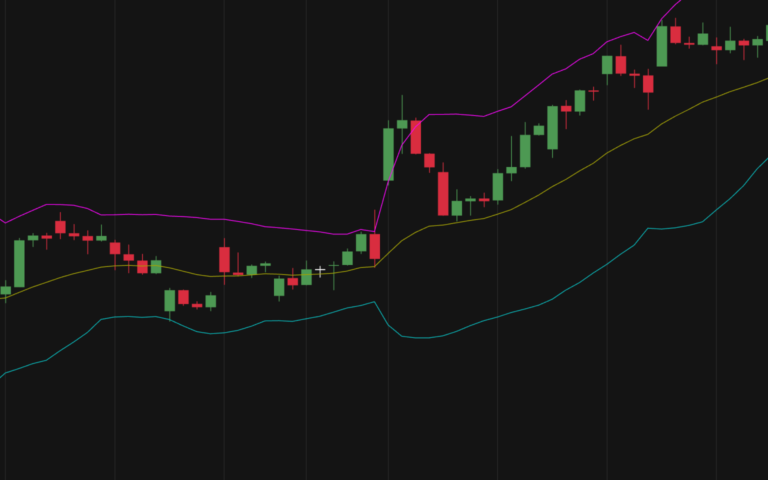
Bollinger Bands are often displayed with a prominent shaded area between the upper and lower bands. While visually striking, this fill can sometimes hide important candlestick patterns and chart structure.
Consider simplifying the display by reducing the opacity of the fill or removing it entirely. This keeps the two bands and the middle moving average visible while price action stays readable.
The goal is to notice how price interacts with the bands, not to focus on the colored background itself.
When the market is trending, the price may repeatedly touch or ride along an outer band. During consolidation, the bands often contract, signaling reduced volatility and the potential for a future expansion.
These relationships become easier to recognize when the chart is visually uncluttered.
Keep RSI simple
The Relative Strength Index is most effective when used as a secondary source of information rather than a signal generator.
Many traders immediately look for overbought and oversold readings above 70 or below 30. While these levels can be useful, RSI often provides more value by confirming or questioning what price is already showing.
For example, if price reaches a new high but RSI fails to reach a corresponding high, momentum may be weakening. Conversely, if price forms a lower low while RSI forms a higher low, selling pressure may be fading.
Rather than reacting to every RSI movement, use it as a tool for context and confirmation.
Create a structured visual workflow
A clean chart encourages a structured analysis process:
- Start with price action and market structure.
- Observe how price interacts with the Bollinger Bands.
- Check whether RSI supports the current move.
- Make a trading decision based on the combined evidence.
This workflow keeps the focus on the market itself rather than on individual indicators.
Less can be more
The most useful chart presents a small amount of information in a form you can read quickly.
By reducing visual noise, adjusting indicator opacity, removing unnecessary fills, and limiting your analysis to a small set of complementary tools, you can create charts that are easier to read and faster to interpret.
Price action stays visible while the indicators add context, and every element on the screen earns its place. That balance is often more powerful than any collection of additional signals.