Every trader eventually encounters the same problem: standard indicators are useful, but they rarely fit a strategy perfectly.
Perhaps you want an RSI that only highlights signals during strong trends, or a moving average that changes color as volatility rises. Maybe you have built your own combination of indicators that you still calculate by hand every day.
In the past, turning these ideas into working tools required programming knowledge.
With DXcharts custom indicators, traders can create their own technical studies using JavaScript. And thanks to modern AI tools, you may not need to write much code yourself.
Why build a custom indicator?
Most built-in indicators are designed for broad audiences.
RSI, MACD, Bollinger Bands, and moving averages work well because they solve common trading problems. But every trader eventually develops personal preferences and rules that are difficult to express using standard tools.
For example, you might want an indicator that:
- Combines RSI and volume into a single signal.
- Highlights candles only when multiple conditions align.
- Displays custom support and resistance levels.
- Visualizes a proprietary trading setup.
- Generates alerts based on your specific strategy.
Custom indicators let you turn ideas into tools that fit your workflow, rather than adapting your workflow to generic indicators.
The rise of “vibe coding”
Traditionally, creating an indicator required learning a programming language and understanding a charting platform’s development framework.
Today, a growing number of traders are using a different approach often called “vibe coding.”
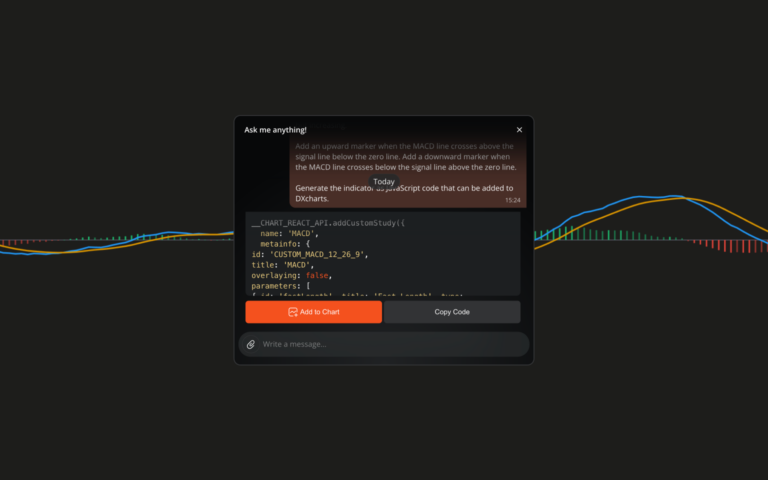
The concept is simple: instead of writing code yourself, you describe what you want in plain English and let an AI assistant generate the code.
Modern tools such as Claude, Google AI Studio, Cursor, ChatGPT, and similar AI coding assistants can often produce working indicator scripts from surprisingly detailed natural-language descriptions.
For example, instead of writing code, you might simply describe your idea:
“Create an indicator that plots a 20-period moving average. Color it green when the slope is positive and red when the slope is negative. Add markers when RSI crosses above 50 while price is above the moving average.”
An AI assistant can then generate a starting implementation that you can refine and test.
Think like a trader, not a programmer
The most successful custom indicators usually begin with a trading problem rather than a technical specification.
Instead of asking:
“How do I write a JavaScript indicator?”
Ask:
“What information am I trying to see more clearly?”
Perhaps you repeatedly perform the same analysis every day. Perhaps you combine three indicators and mentally calculate a signal before making a decision.
Those repetitive processes are often excellent candidates for automation.
The more precisely you can state your trading logic, the easier it becomes for an AI assistant to turn it into code.
Start small
One common mistake is trying to build an entire trading system at once.
Instead, begin with a small enhancement.
Examples include:
- Adding visual highlights to existing indicators.
- Combining two commonly used signals.
- Creating custom alerts.
- Displaying important information directly on the chart.
- Automating calculations you perform manually.
Simple projects are easier to test and improve, and they often deliver value sooner.
Iterate and improve
Creating a custom indicator is rarely a one-time process.
After using an indicator in live market conditions, you may find that certain signals fire too often or that a threshold or visual element needs adjusting.
This is where AI-assisted development becomes particularly powerful.
Rather than rewriting code from scratch, you can simply describe the changes you want:
“Make the signals less frequent.”
“Add a volatility filter.”
“Show the indicator in a separate panel.”
“Change the colors and add labels.”
The AI can help generate revised versions while you remain focused on trading logic.
Turn ideas into tools
The most valuable trading insights are often the ones you develop yourself.
With DXcharts custom indicators, those ideas no longer need to stay locked in handwritten notes or spreadsheet formulas. They can become visual tools integrated directly into your charts.
And modern AI assistants shift the effort from writing code to describing what you want to see.
The result is a more personalized trading experience: one where your charts grow with your strategy.