Many traders analyze the market using a single chart and constantly switch between timeframes. While this approach works, it can make it difficult to maintain context and spot how short-term price movements fit into the bigger picture.
A more efficient approach is to view multiple timeframes simultaneously.
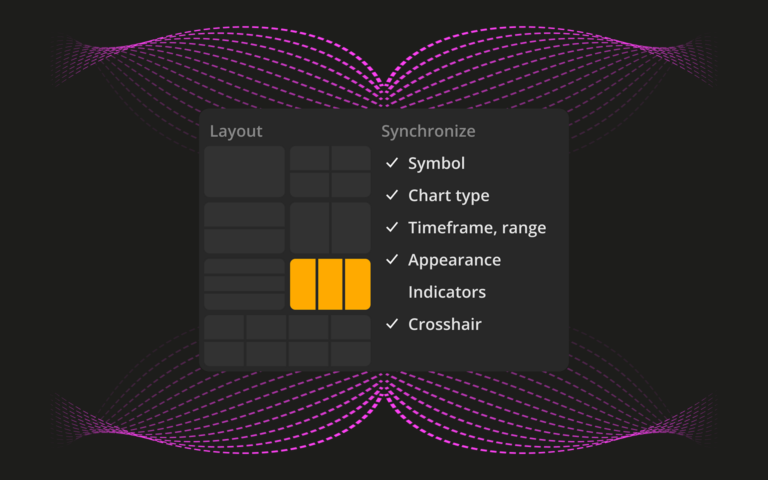
With DXcharts Multichart, you can divide your workspace into multiple chart panels, each configured independently with its own timeframe, indicators, drawings, and visual settings. Instead of repeatedly switching views, you can watch the broader trend and its underlying structure while spotting execution opportunities at the same time.
Why professional traders use multiple timeframes
Different timeframes answer different questions.
A Daily chart helps identify the dominant market trend.
A 1-Hour chart reveals the structure of that trend, including pullbacks, consolidation zones, and key support or resistance levels.
A 5-Minute chart provides the precision needed for trade entries and exits.
When all three views are visible simultaneously, decisions become more consistent because every trade can be evaluated within a broader market context.
Instead of asking, “Should I buy here?” you can ask whether the Daily trend and 1-Hour structure both point the same way, and whether the 5-Minute chart gives you a sound entry. This process cuts down impulsive trades and gives your decisions a repeatable structure.
Create a three-chart trading layout
One popular setup uses a three-chart grid:
Daily chart: trend analysis
Use the Daily timeframe to determine the market’s primary direction.
Focus on:
- Major support and resistance zones
- Trend direction
- Long-term moving averages
- Significant chart patterns
The Daily chart acts as your strategic view of the market.
1-Hour chart: market structure
The 1-Hour chart bridges the gap between long-term analysis and short-term execution.
Use it to identify:
- Pullbacks within the trend
- Breakout levels
- Consolidation areas
- Potential trade locations
This chart provides the context behind the trade idea.
5-Minute chart: execution
The 5-Minute chart is where trading decisions become actionable.
Use it for:
- Entry timing
- Stop-loss placement
- Short-term momentum confirmation
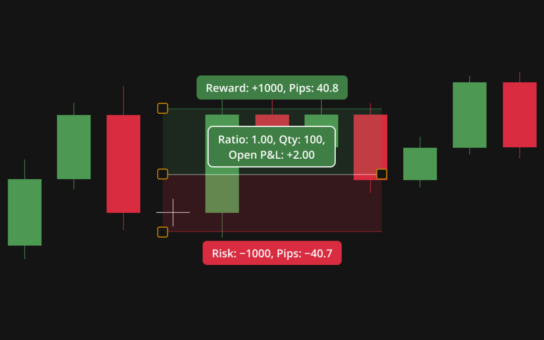
- Risk/reward planning
By separating these responsibilities across multiple charts, each timeframe serves a distinct purpose rather than competing for attention.
Save your workspace as a layout
Once your charts are configured, save them as a layout.
DXcharts layouts act as snapshots of your chart workspace and application state. This allows you to quickly return to the same configuration without rebuilding it each time you open the platform. You can save several layouts and switch between them as your needs change.
Many traders maintain separate layouts for different tasks, such as:
- Intraday trading
- Swing trading
- Market scanning
- End-of-day review
Having predefined workspaces reduces setup time and helps maintain consistency.
Build a trading journal with chart snapshots
A professional workflow does not end when a trade is placed.
One of the most valuable habits a trader can develop is documenting the reasoning behind every position.
Before entering a trade, use the chart drawing tools to mark:
- Support and resistance levels
- Entry points
- Stop Loss levels
- Take Profit targets
- Trendlines and annotations
Then capture a chart snapshot.
DXcharts allows traders to create chart snapshots that can be saved locally or copied for sharing and documentation.
Because all charts in your workspace are visible simultaneously, the resulting image captures the complete decision-making process, from the higher-timeframe trend to the execution chart.
Many traders save these screenshots in note-taking apps such as Notion or OneNote, along with notes on why they took the trade and how it turned out.
Turn analysis into a repeatable process
Beyond saving setup time, Multichart and saved layouts keep your analysis consistent from one session to the next.
By reviewing the same timeframes in the same workspace and documenting each trade with chart snapshots, you build a process you can evaluate and improve over time.
The market changes every day. Your workflow should not.
A well-designed multi-chart layout helps you focus less on managing windows and more on making informed trading decisions.